
 Share
Share


Moving average crossover strategies are one of the first mechanical rules new traders encounter. By tracking when a faster trendline crosses a slower one, this approach aims to capture momentum early without relying on gut feel. However, because moving averages rely on past price data, managing lag and range-bound false signals is crucial to making the strategy work in real-world trading.
When integrated into an automated framework like AlgoBot, crossover rules shift from manual chart-watching to structured, rule-based execution. This guide breaks down how moving average crossovers work, where they fail, and how to combine them with risk controls and trend filters for cleaner trade execution.
Key Takeaways
- Moving average crossovers identify momentum shifts by comparing short-term price velocity against long-term baselines.
- The biggest hurdle is the “whipsaw” effect — frequent false signals during sideways or low-volatility consolidation.
- Adding volume, ADX, or higher-timeframe trend filters significantly increases signal quality.
- Automation ensures instant order routing when a candle closes, eliminating emotional hesitation or missed entries.
- AlgoBot helps structure crossover rules alongside dynamic stop-losses, position sizing, and automated risk limits.
What Is a Moving Average Crossover?
A moving average crossover happens when a faster moving average crosses above or below a slower moving average. Traders often read a bullish crossover as a possible uptrend signal and a bearish crossover as possible downside momentum.
In algorithmic terms, moving averages smooth out raw price fluctuations over a defined period of historical bars. When a short-term average crosses a long-term average, it indicates that recent price velocity is accelerating relative to the established baseline trend.
Automated platforms interpret this interaction as a binary event: either the condition is met on the current bar, or it is not. However, rather than acting on every cross indiscriminately, robust trading systems evaluate whether the slope of the underlying averages reflects genuine momentum or temporary market noise.
Why Bots Like This Strategy
The rule is objective. A bot does not need to guess whether a chart “looks bullish”; it only needs to check whether one line crossed another. This makes moving average crossovers easy to automate and backtest.
Because the logic relies on mathematical thresholds, a trading script can process thousands of historical price bars across multiple assets without subjective bias. Parameters such as calculation period, candle close confirmation, and execution latency can be systematically backtested to establish expected drawdown and win-rate profiles.
Additionally, automated systems eliminate execution delays that human traders face when waiting for a crossover event. Once the candle closes and confirms the mathematical intersection, an algorithm routes the order instantly to the broker or exchange while applying pre-programmed risk parameters.
Common Moving Average Pairs
Popular examples include the 9 and 21 EMA for shorter-term trading, the 20 and 50 MA for medium-term trends, and the 50 and 200 MA for longer-term trend analysis.
Short-term combinations, like the 9 and 21 Exponential Moving Averages (EMA), give greater weight to recent prices, making them responsive to sudden shifts in intraday momentum. However, this high sensitivity makes them prone to frequent false signals during low-volatility or choppy sessions.
Conversely, macro pairs like the 50 and 200 Simple Moving Averages (SMA)—famously known as the Golden Cross and Death Cross — smooth out minor noise to highlight major market regimes. The trade-off is significant lag, meaning systematic strategies using these pairs often enter well after a primary trend has established itself.
The Main Weakness
Crossovers can lag. By the time the signal appears, a large part of the move may already have happened. In choppy markets, crossovers can also flip back and forth repeatedly.
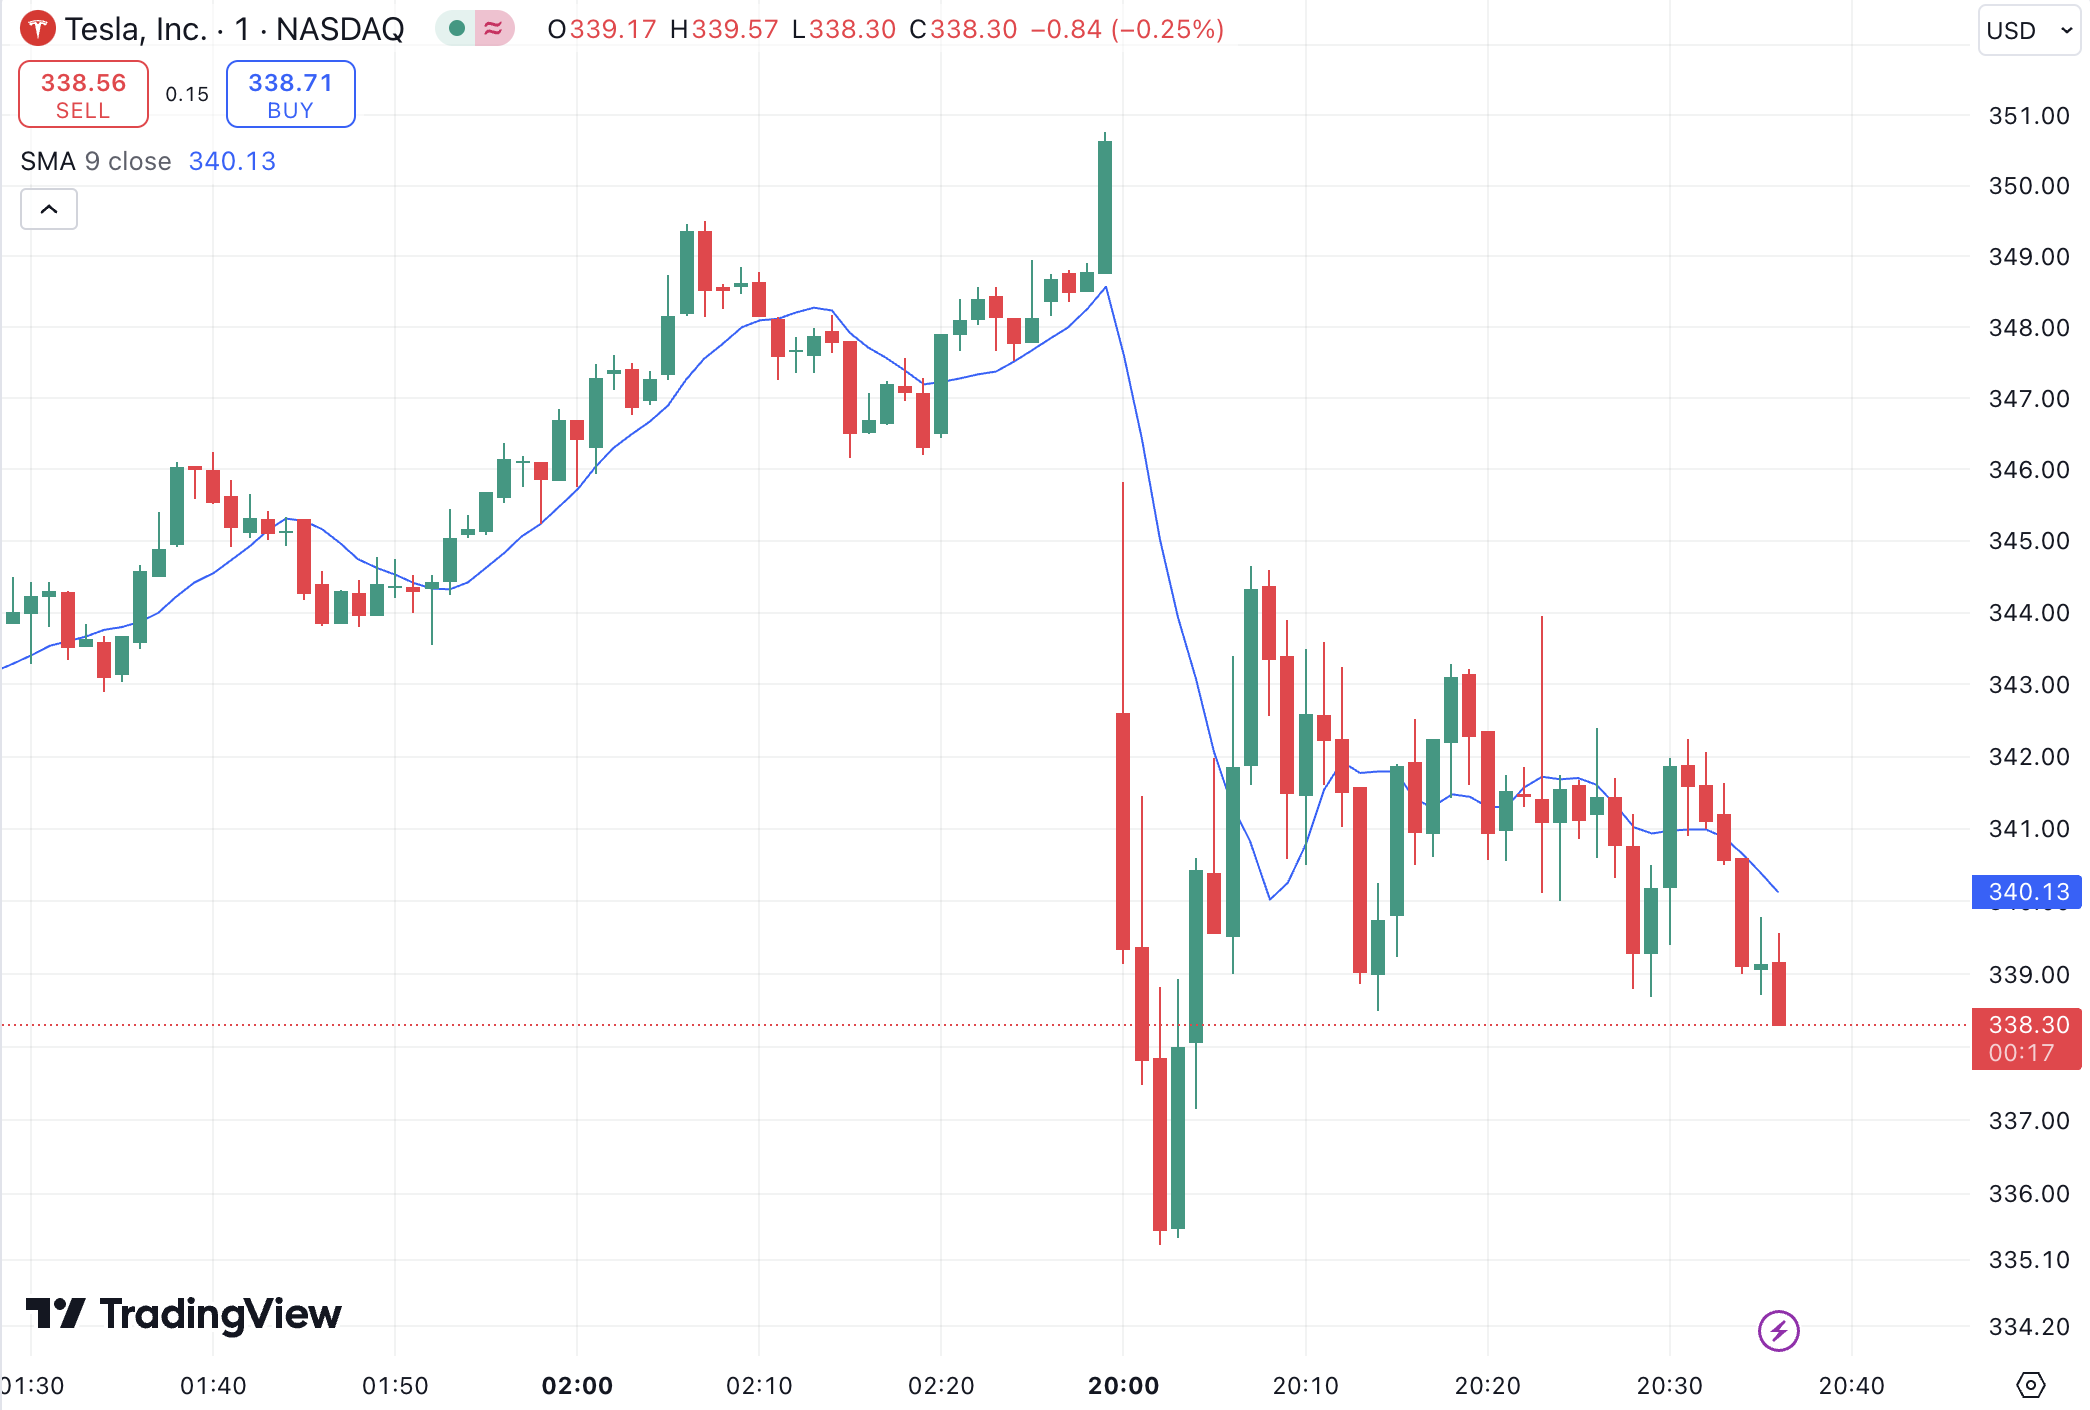
This lag occurs because moving averages are backward-looking calculations. In a sideways or range-bound market, price repeatedly oscillates across the moving averages, causing the algorithm to buy near the top of the range and sell near the bottom — a scenario known as getting “whipsawed.”
Accumulated losses from consecutive whipsaw trades during low-volatility consolidation are the primary cause of severe drawdown in basic crossover strategies. Without secondary filters to pause execution during non-trending regimes, single-crossover systems bleed capital quickly.
How to Improve the Strategy
Traders can add filters such as higher-timeframe trend, volatility, support and resistance, or minimum candle close confirmation. Stops and targets should be defined before the trade opens.
One common enhancement is layering an Average Directional Index (ADX) filter to verify trend strength before taking crossover entries. Requiring an ADX reading above 20 ensures the bot only executes signals when the market demonstrates sufficient directional power to sustain the breakout.
Another popular structural fix is requiring multi-timeframe alignment. For example, an automated strategy might only execute a bullish 9/21 EMA crossover on a 15-minute chart if price is simultaneously trading above the 200-period moving average on the 4-hour chart, filtering out high-risk counter-trend trades.
Using Crossovers in AlgoBot-Style Workflows
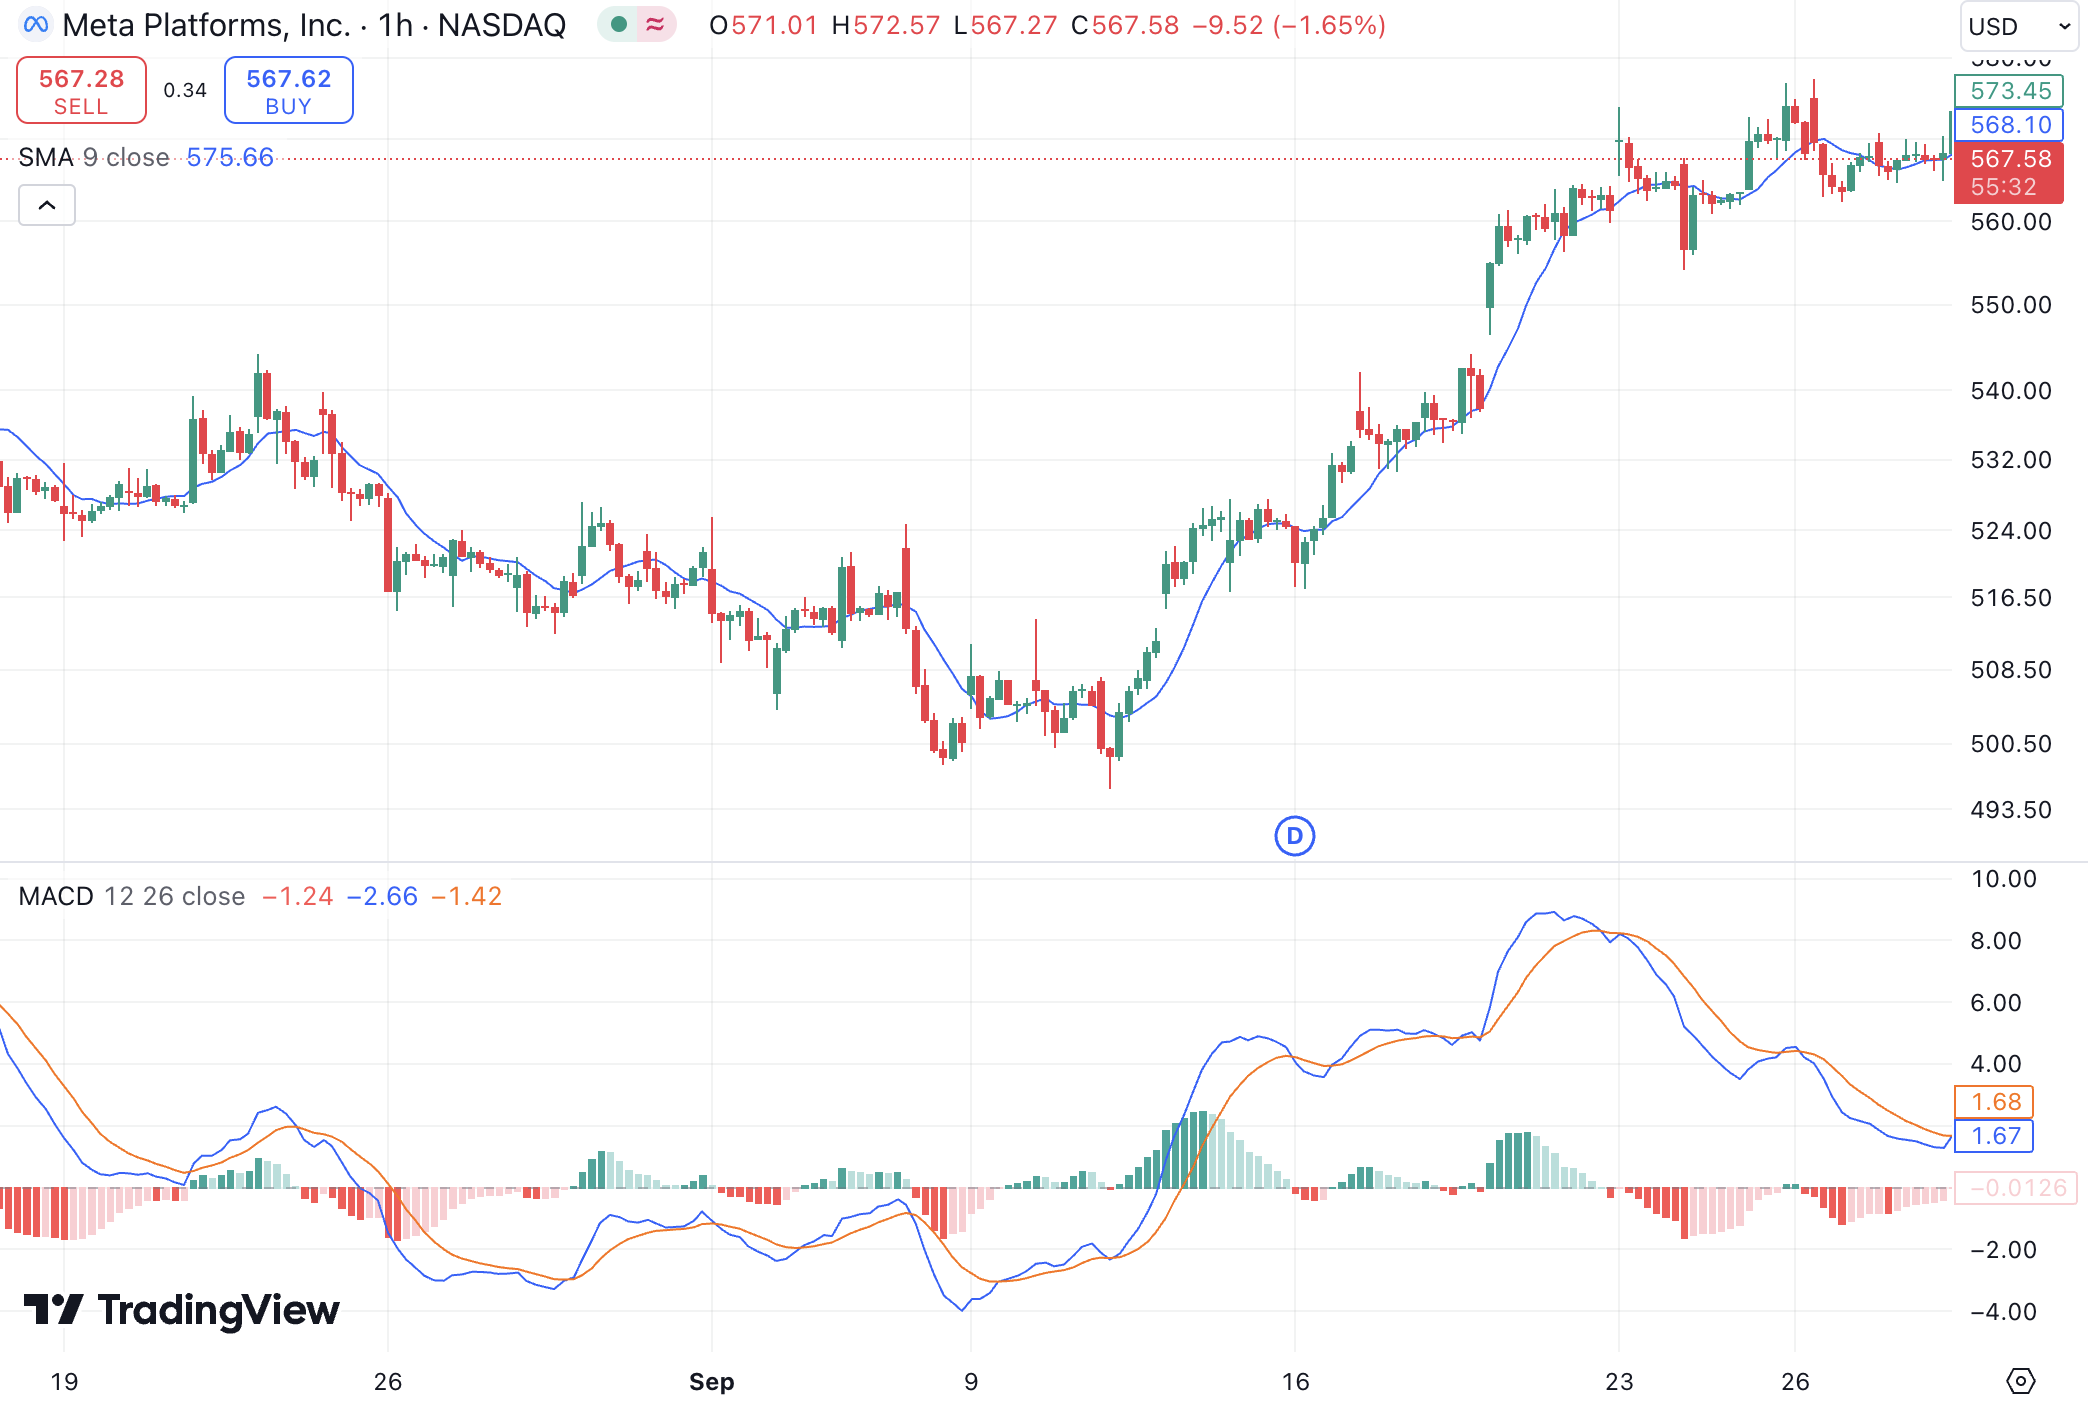
A crossover can be one signal inside a broader automated framework. It is usually stronger when combined with momentum, volatility, and risk rules rather than used alone.
Within a complete algorithmic stack, a moving average crossover functions as an initial trigger rather than the sole decision-maker. Once the crossover condition fires, secondary conditions—such as volume spikes, key liquidity zone breaks, or RSI divergence — must confirm before the entry command executes.
Furthermore, automated risk controls actively govern the trade post-entry. The platform can calculate dynamic stop-loss levels based on recent swing highs/lows or Average True Range (ATR), trailing the exit price automatically as the trend progresses to protect accrued profits.
Practical Example
Consider a trader using a 9/21 EMA crossover strategy on the 1-hour EUR/USD chart. During a period of news-driven volatility, the 9 EMA crosses sharply above the 21 EMA on a confirmed candle close. Rather than entering manually — where slippage or emotional hesitation could delay entry — the automated system detects the crossover instantly.
Before routing the order, the system validates secondary rules: checking that price is above the 200 SMA on the 4-hour chart and that the Average True Range (ATR) indicates healthy expansion. If validated, it enters a long position, places a stop-loss just below the recent swing low, and sets an automated trailing stop to lock in profits as the move progresses.
Common Mistakes Beginners Make
- Tweaking MA lengths (e.g., using 11 and 23 instead of 9 and 21) to fit historical charts perfectly, leading to curve-fitting that fails in live trading.
- Allowing an algorithm to execute every crossover during a range-bound phase, leading to heavy “whipsaw” losses.
- Executing a trade mid-bar while the averages temporarily touch, only for price to reverse and cancel the crossover before the bar closes.
- Taking a 5-minute bullish crossover directly into major 4-hour resistance or against a macro downtrend.
- Underestimating how rapid crossovers on short timeframes can erode capital through trading fees and wider spreads.
How AlgoBot Can Fit Into the Workflow
AlgoBot streamlines moving average crossover strategies by handling signal filtering, execution speed, and position management automatically. Instead of relying solely on basic crossover lines, traders can configure AlgoBot to cross-reference entries with secondary indicators, custom volatility parameters, and trend regime filters.
Once a valid crossover signal triggers, AlgoBot enforces disciplined execution by calculating position sizes based on pre-set risk parameters and automatically managing exit rules—such as trailing stops or profit targets. This allows traders to backtest crossover logic rigorously in demo environments before deploying capital with strict safety controls in live markets.
Final Thoughts
Moving Average Crossover Strategy Explained is ultimately about structure. Traders do not need more random opinions; they need clear rules, consistent execution, and risk limits that protect them during bad conditions. Automation can help with that, especially when it is paired with education and realistic expectations.
For users comparing trading tools, the strongest platform is usually the one that makes disciplined behaviour easier: clear signals, sensible risk controls, transparent setup steps, and the ability to pause or adjust when conditions change. That is the standard beginners should use when evaluating AlgoBot or any other automated trading solution.
FAQs
What is a golden cross?
A golden cross usually refers to the 50-period moving average crossing above the 200-period moving average.
What is a death cross?
A death cross usually refers to the 50-period moving average crossing below the 200-period moving average.
Do crossover strategies still work?
They can work in trending markets, but they often struggle in ranges.
Educational content only. Trading involves risk, and past or historical performance does not guarantee future results.