
 Share
Share


When automated trading strategies fail, it is rarely because they couldn’t generate profits. More often, it is because they encountered a drawdown so severe that the account could not survive the decline. In quantitative and algorithmic trading, drawdown is arguably the single most critical risk metric a trader must measure, monitor, and manage.
Every trading system—no matter how sophisticated or profit-focused—experiences drawdowns. Understanding how drawdown works, what factors exacerbate equity dips, and how to program hard risk boundaries into your automated environment is essential to keeping your trading account operational for the long haul.
Platforms like AlgoBot place drawdown awareness at the center of strategy development, helping traders balance return targets with active guardrails that protect capital during hostile market conditions.
Key Takeaways
- Drawdown defined: Drawdown measures the peak-to-trough decline in account value, expressed as a percentage or currency amount.
- Psychological & capital survival: A high-return strategy with massive drawdowns is practically untradeable due to psychological stress and mathematical recovery requirements.
- Core drivers: Position sizing, excessive leverage, market volatility, and consecutive losing streaks heavily impact drawdown magnitude.
- Algorithmic risk controls: Daily loss limits, maximum open position caps, and dynamic equity kill-switches prevent bots from spiraling during unfavorable market regimes.
- AlgoBot philosophy: Prioritizing longevity over unsustainable spikes; surviving drawdowns ensures you remain capitalized to capture future market edges.
What Is Drawdown in Algorithmic Trading?
Drawdown measures the reduction in your trading capital after a series of unprofitable trades, calculated from the strategy’s peak equity to its subsequent low point.
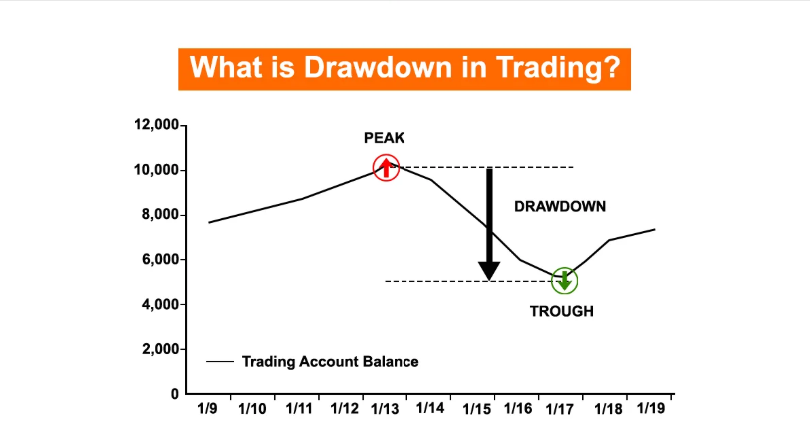
For example, if an automated account reaches a record high balance of $10,000 and then experiences a series of losing trades that drop the equity balance to $8,500 before returning upward, the drawdown is $1,500—or exactly 15%.
Drawdown Calculation Formula:
Drawdown (%) = [(Peak Equity − Trough Equity) / Peak Equity] × 100
Drawdown is not measured from your initial starting balance, but from the highest account peak achieved during execution. Every new account high creates a new baseline against which future drawdowns are measured.
Maximum Drawdown vs. Relative Drawdown
When evaluating performance reports, traders typically encounter two distinct types of drawdown figures:
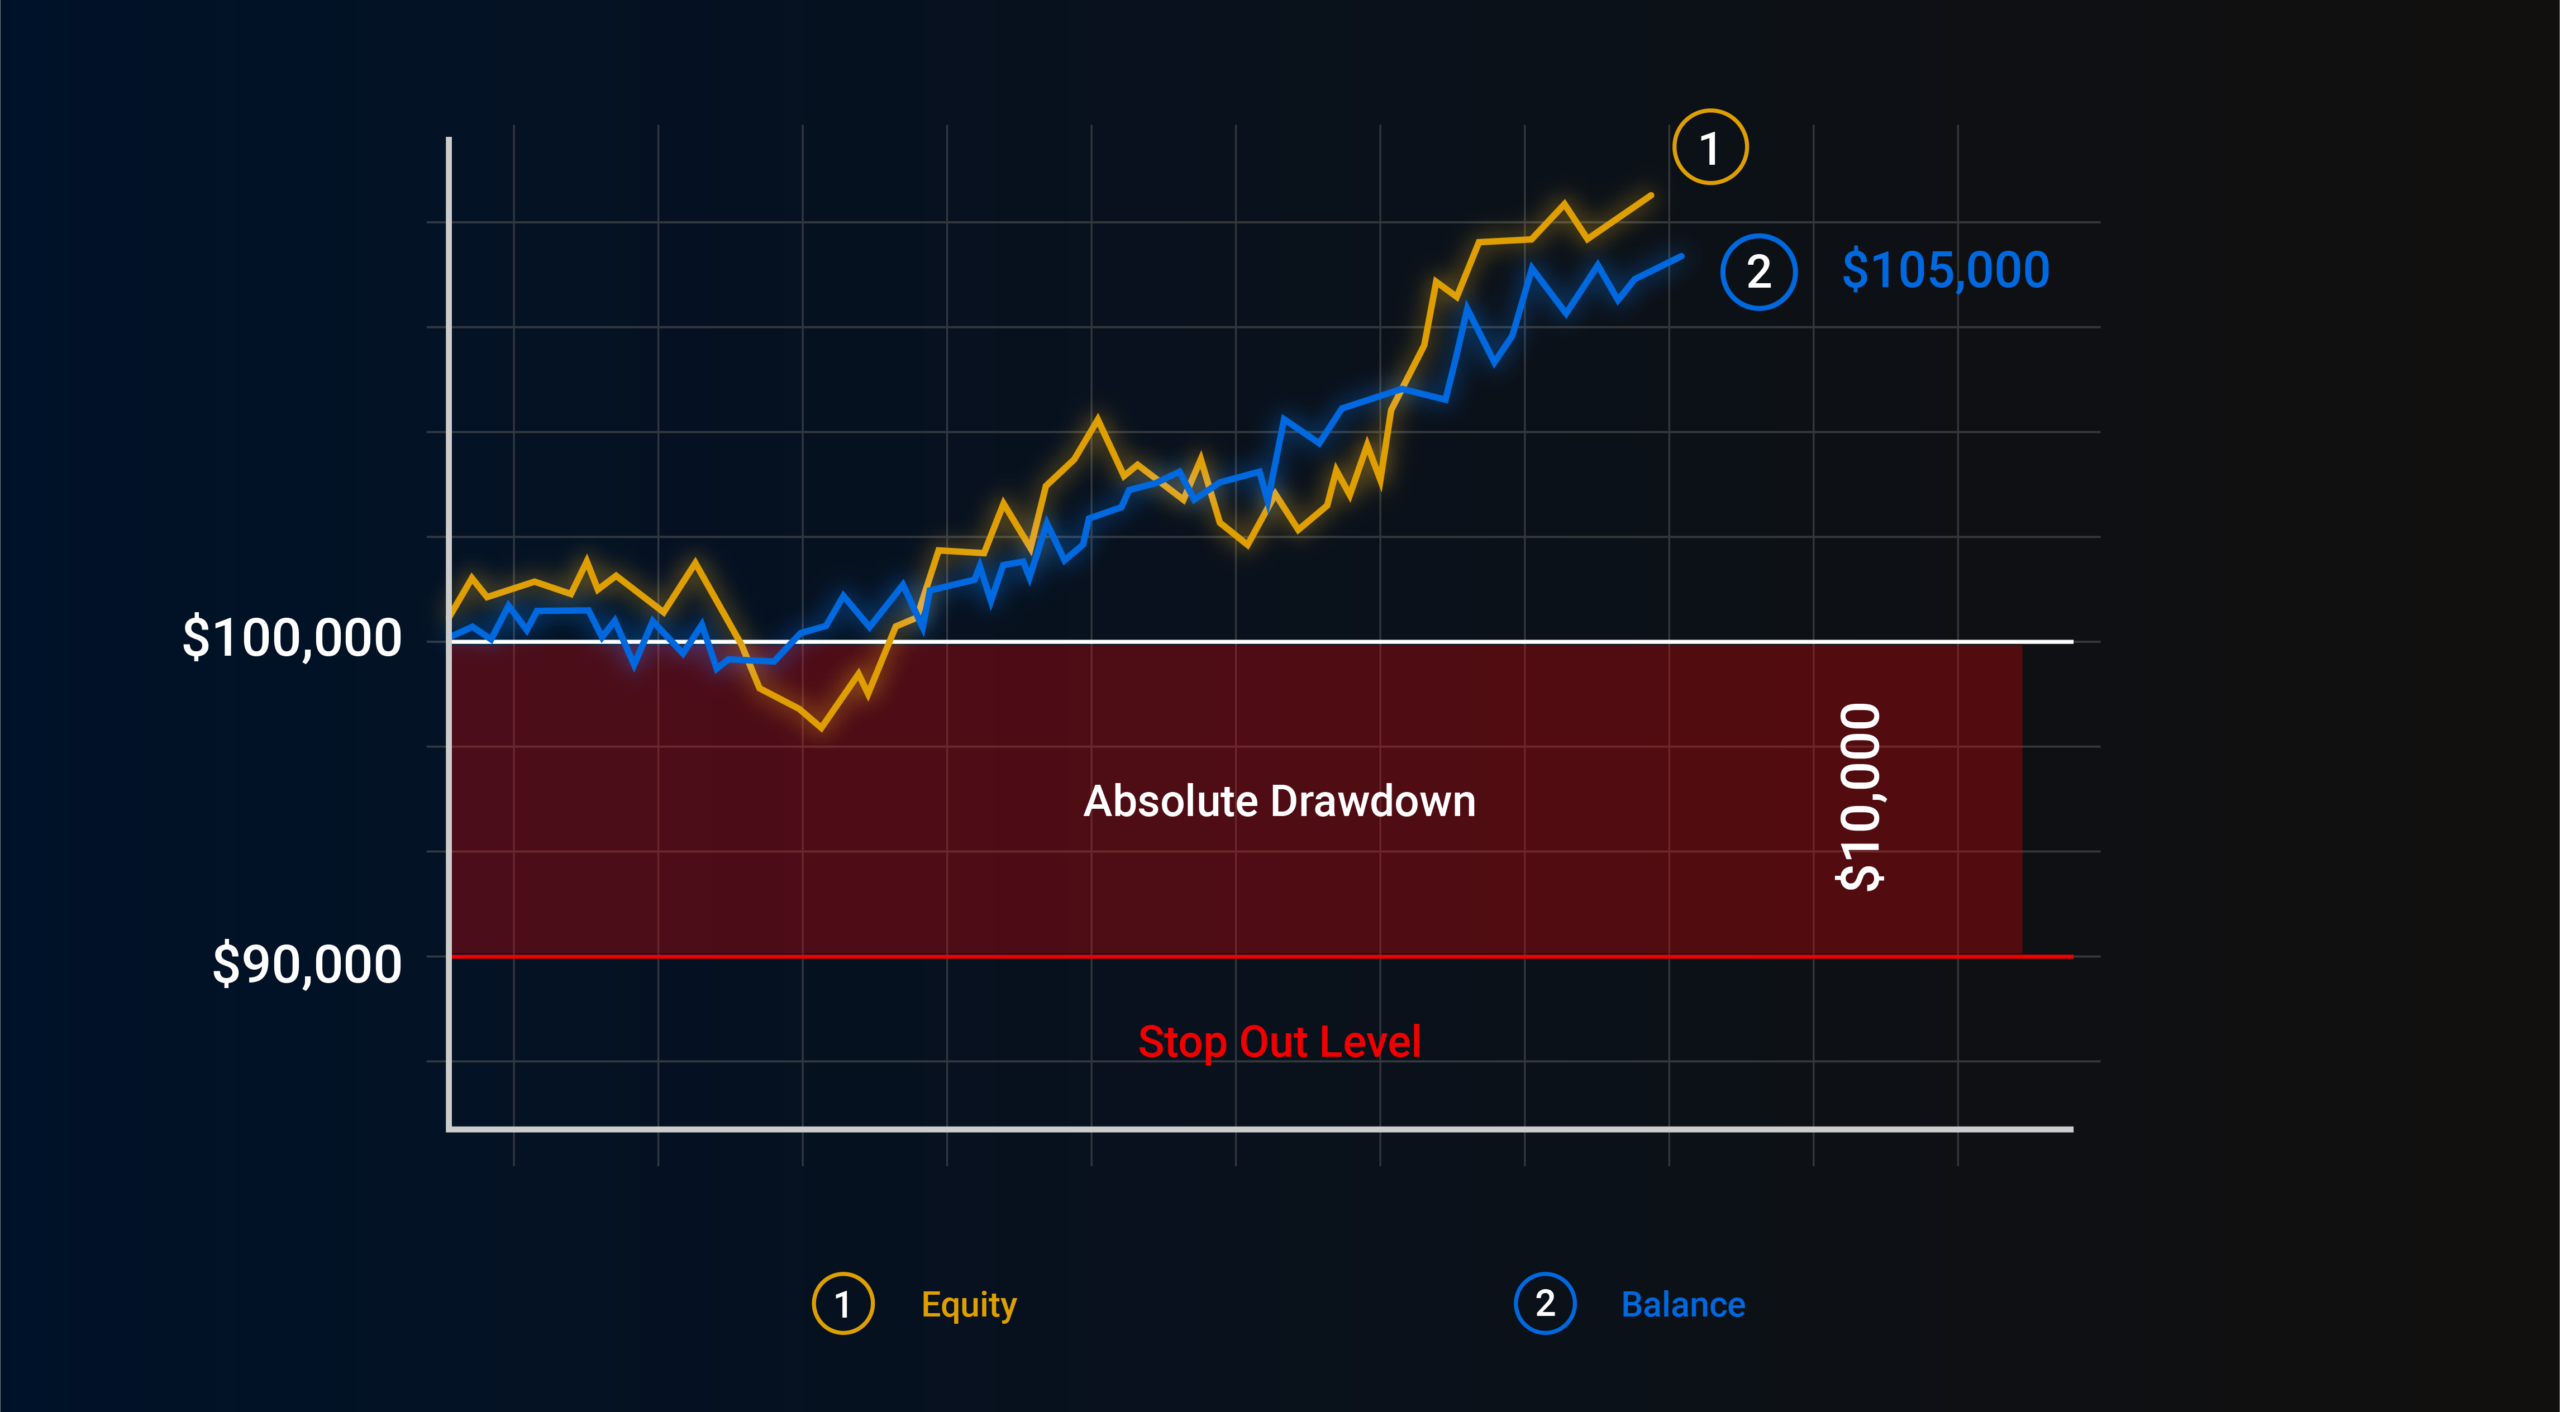
- Maximum Drawdown (MDD): The single largest peak-to-trough percentage loss experienced across the entire evaluation period. It highlights the historical worst-case scenario for your strategy.
- Relative Drawdown: The maximum drawdown expressed relative to specific account equity phases or varying leverage levels over time, offering insight into ongoing operational risk.
The Mathematics of Drawdown Recovery
The primary reason drawdown must be tightly managed is mathematical asymmetrical risk: as drawdown percentage deepens, the gain required just to break even grows exponentially.
| Account Drawdown (%) | Capital Remaining | Gain Required to Break Even | Risk Assessment |
|---|---|---|---|
| 10% | 90% | 11.1% | Easily manageable; normal trading variance. |
| 20% | 80% | 25.0% | Standard institutional safety threshold. |
| 30% | 70% | 42.8% | Elevated risk; strategy reconfiguration required. |
| 50% | 50% | 100.0% | Severe impairment; requires doubling capital to recover. |
| 75% | 25% | 300.0% | Critical failure; account recovery is mathematically improbable. |
If your strategy suffers a 50% drawdown, your remaining capital must generate a 100% gain simply to get back to where you started. Protecting against severe drawdowns is therefore far more important than pursuing speculative gains.
Key Drivers of High Drawdown in Automated Systems
Trading algorithms execute instructions strictly according to code. If market dynamics shift and protective mechanisms are absent, bots can sustain compounding losses quickly. Main drivers include:
1. Excessive Position Sizing & Leverage
Over-leveraging capital magnifies small market moves against your position. A strategy risking 5% to 10% of total equity per trade faces catastrophic drawdown during normal 4-to-5 trade losing streaks.
2. Absence of Volatility Adapters
Fixed stop-loss levels that perform well during low-volatility periods get hit repeatedly during high-volatility news events or market shocks.
3. Uncapped Exposure Across Correlated Assets
If a bot enters long positions simultaneously on EUR/USD, GBP/USD, and AUD/USD, it takes on tripled USD exposure. A sudden US Dollar rally triggers correlated losses across all open trades.
4. Martingale or Grid Mechanics Without Hard Limits
Strategies that double down on losing positions (Martingale) or continuously place orders against a strong directional trend (Grid) create smooth equity curves during ranging markets, but cause total account wipeouts when strong trends emerge.
How AlgoBot Controls and Reduces Drawdowns
Algorithmic execution offers a key advantage: it executes automated risk rules without human hesitation, emotional panic, or hope-driven interference.
AlgoBot integrates precise risk architecture to minimize drawdown depth and protect live accounts:
- Daily Loss Caps: Automatically halts bot activity if equity drops by a predetermined threshold (e.g., 3%) within a single trading day.
- Dynamic Position Sizing: Scales lot sizes relative to current equity and account volatility, automatically reducing exposure during drawdown periods.
- Max Open Order Limits: Restrains the strategy from opening new trades when market correlation or exposure limits are met.
- Trailing Equity Kill-Switches: Instantly closes open positions and deactivates automated trading if overall strategy drawdown reaches specified maximum thresholds.
Final Thoughts
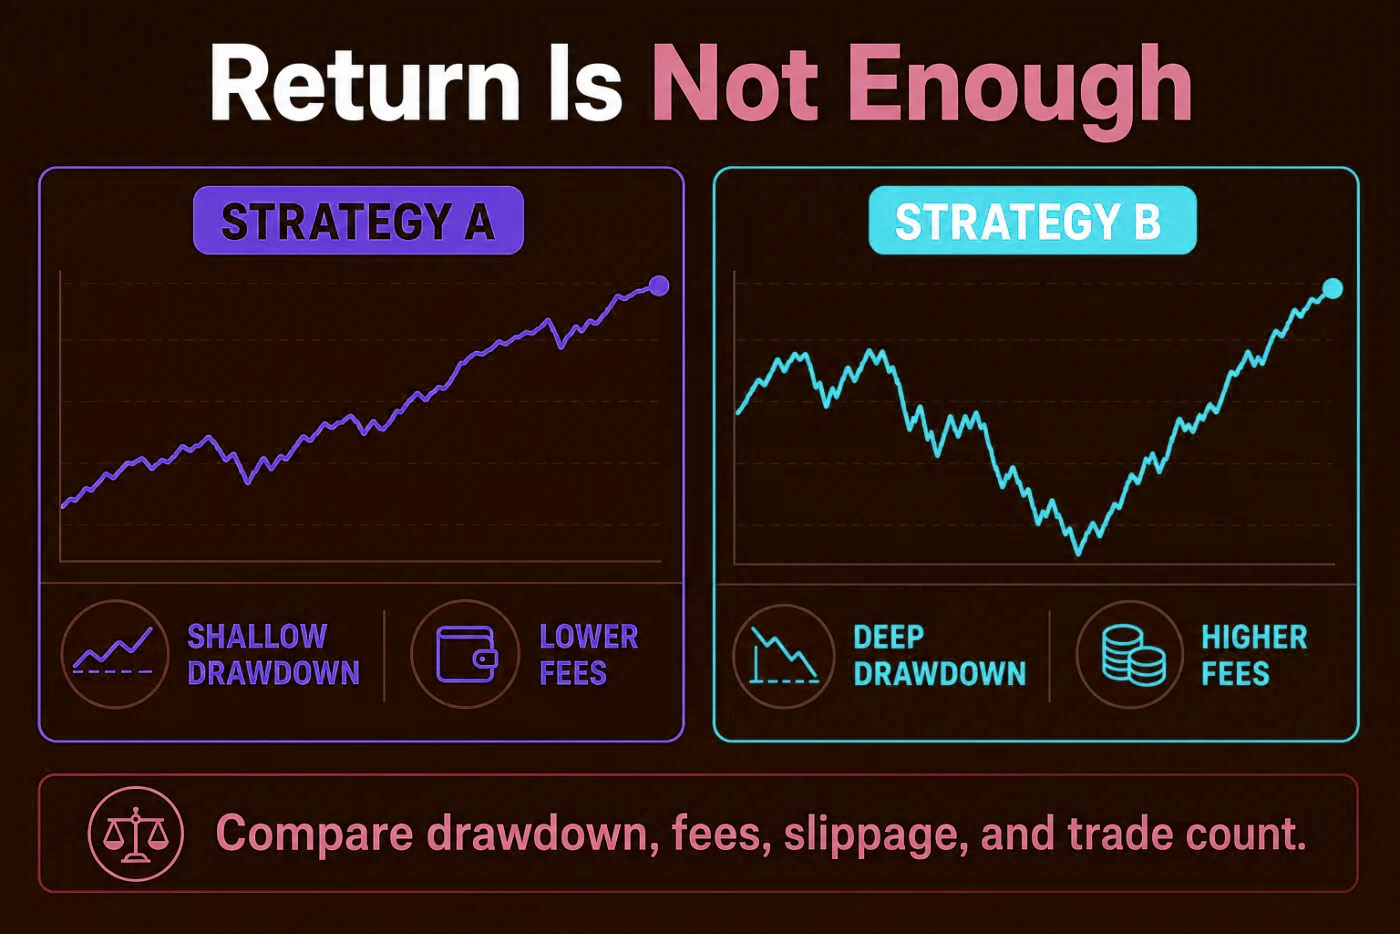
Trading bot profitability gets the headlines, but drawdown management determines survival. A trading system with modest, steady returns and a capped 10% maximum drawdown is vastly superior to a hyper-aggressive bot boasting 200% annual returns with a 60% drawdown history.
By defining explicit loss limits, managing leverage, and treating performance reports as risk evaluation frameworks, traders ensure their automated systems navigate unexpected market turns safely.
FAQs
What is an acceptable maximum drawdown for a trading bot?
For most institutional and retail quantitative traders, a Maximum Drawdown between 10% and 20% is considered acceptable. Anything exceeding 30% introduces significant recovery friction and elevated account blow-up risks.
How do I reduce my bot’s drawdown during live trading?
Reduce position size per trade, lower effective leverage, implement strict daily loss limits, and ensure your system uses volatility-adjusted stop losses (such as ATR-based stops).
Why did my live trading drawdown exceed my backtest drawdown?
Live trading drawdowns often exceed backtests due to real-world factors like execution slippage, broker spreads, overnight swap fees, unexpected market news events, or historical over-fitting during backtesting.
Educational content only. Trading involves risk, and past or historical performance does not guarantee future results.