
 Share
Share


Bollinger Bands are a versatile, volatility-based technical analysis tool widely integrated into automated forex and cryptocurrency trading strategies. By constructing standard deviation envelopes around a central moving average, Bollinger Bands provide trading algorithms with dynamic, self-adjusting price boundaries that adapt instantly to changing market volatility.
Platforms like AlgoBot utilize Bollinger Band logic to power both mean-reversion setups during range-bound consolidation and volatility breakout strategies during market expansion. Understanding how to program standard deviation parameters allows traders to automate execution rules while filtering out false band touches in persistent trend regimes.
Because market conditions shift between consolidation and expansion, trading bots must evaluate band squeezes and multi-timeframe trend context before executing orders. Combining Bollinger Band triggers with automated stop losses and risk-based position sizing ensures that algorithms maintain disciplined execution across forex pairs and volatile digital assets.
Key Takeaways
- Bollinger Bands use standard deviation channels around a central moving average to provide trading bots with dynamic, volatility-adjusted price boundaries.
- Mean-reversion algorithms target price bounces back toward the middle band during range-bound, low-momentum market phases.
- Breakout algorithms scan for tight bandwidth (a Bollinger Squeeze) to capture explosive volatility expansion as price pierces outer bands.
- Cryptocurrency markets often require wider standard deviation settings or secondary trend filters due to higher asset volatility compared to forex.
- AlgoBot integrates automated Bollinger Band signals with dynamic stop-loss rules and position-sizing models to execute structured trading workflows.
What Bollinger Bands Measure
Bollinger Bands show price relative to a moving average and volatility envelope. When bands widen, volatility is increasing. When they contract, the market may be preparing for a larger move.
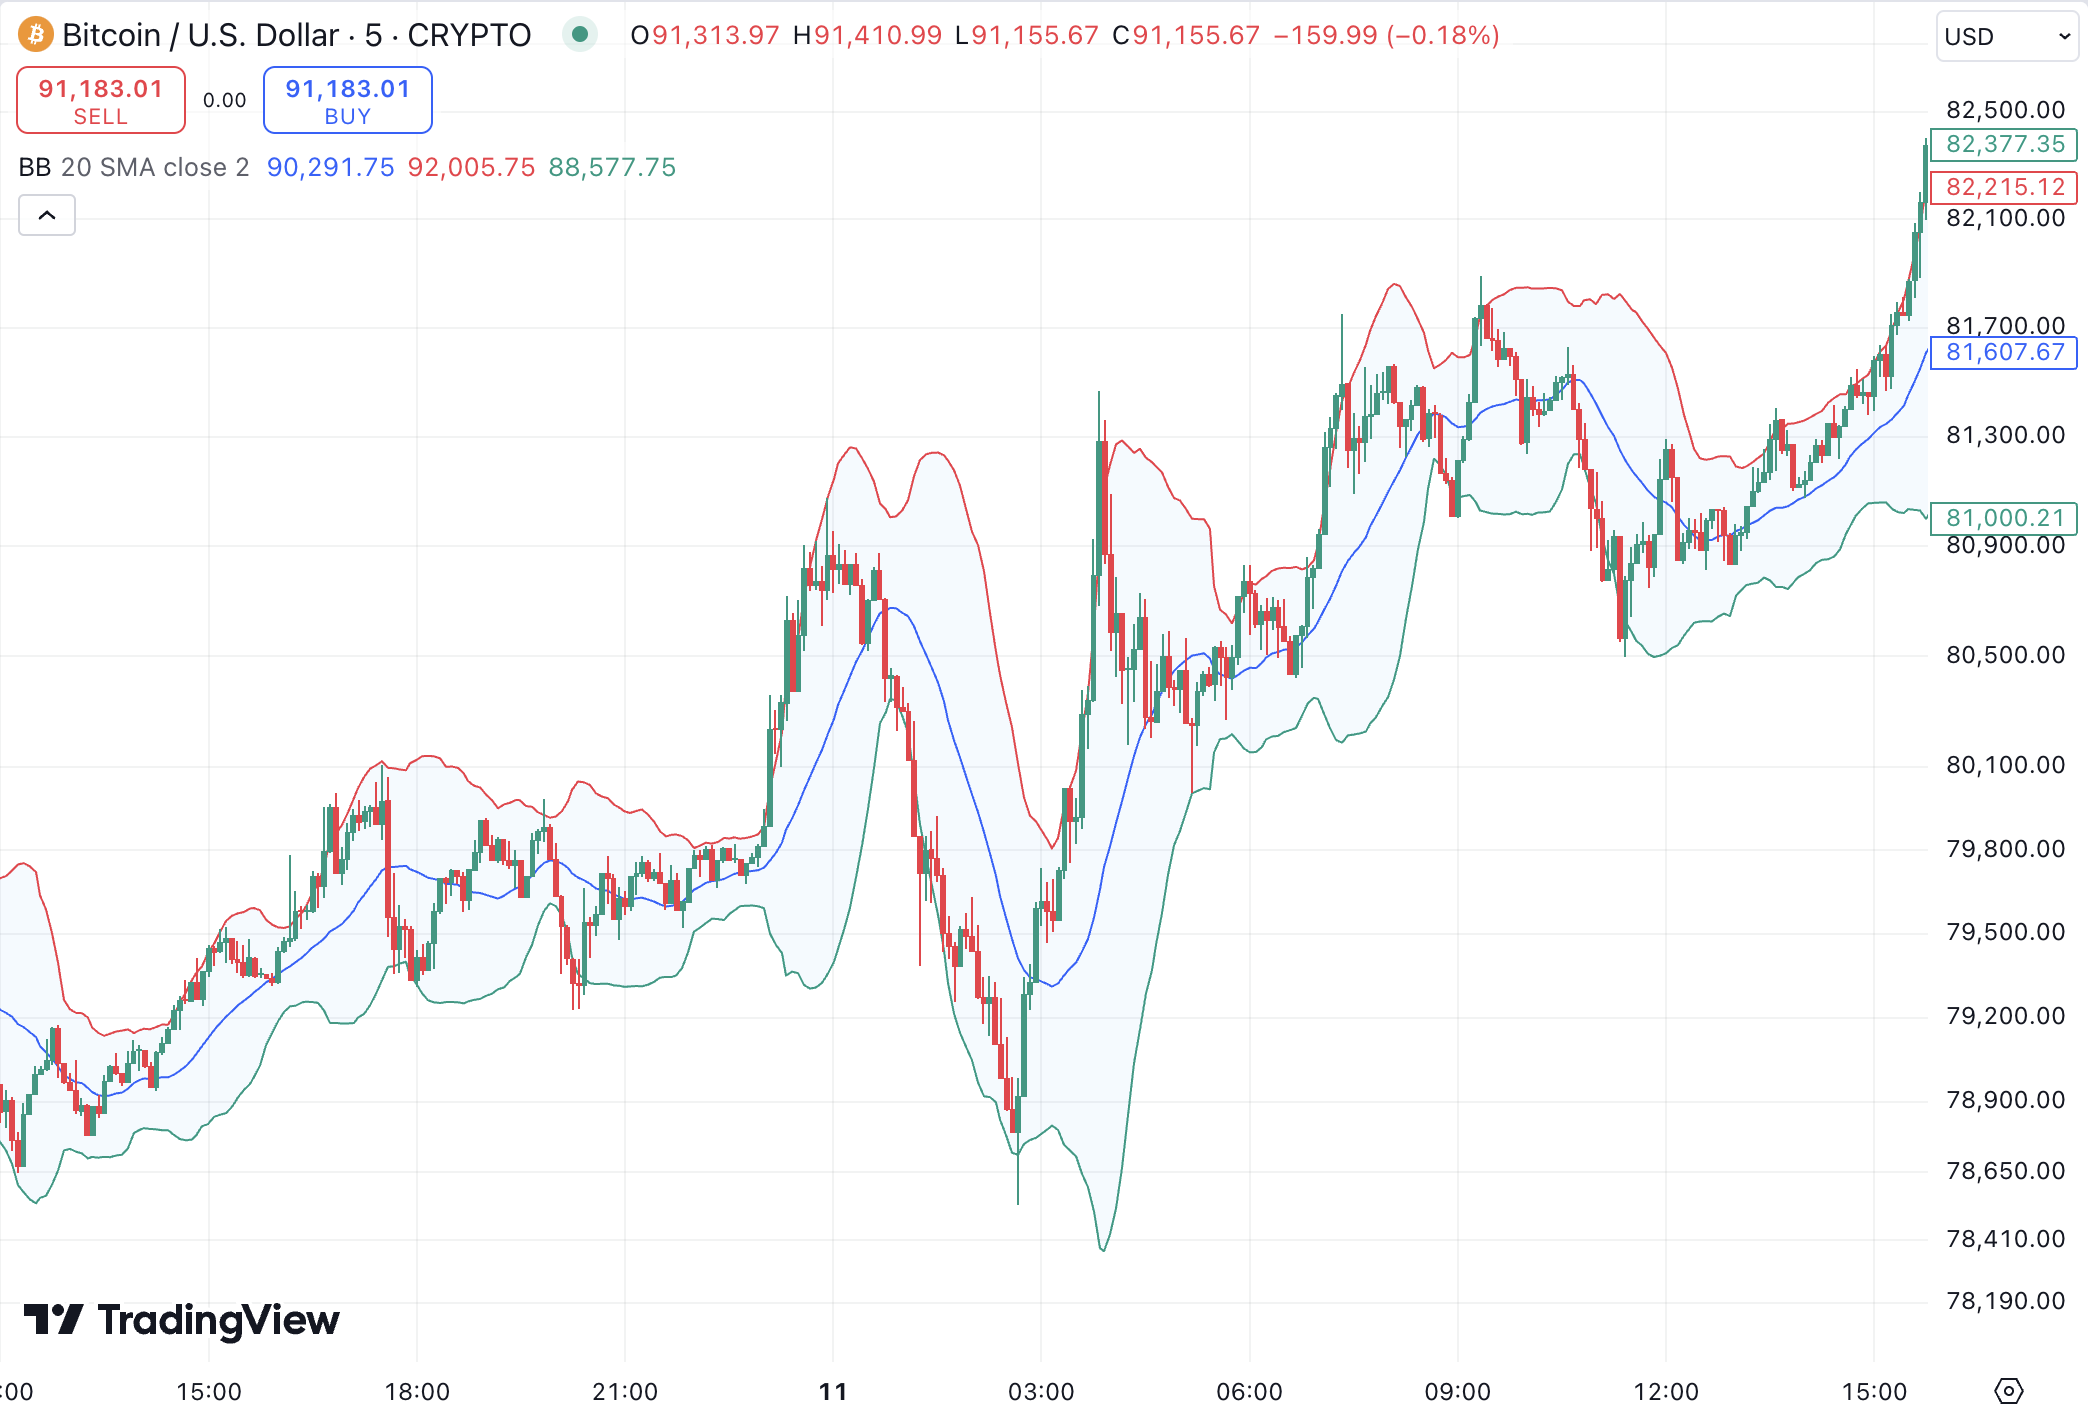
Composed of a middle simple moving average (typically 20 periods) flanked by an upper and lower standard deviation band, the indicator dynamically expands and contracts based on recent market action. In an automated trading system, these dynamic boundaries provide objective, real-time statistical thresholds rather than static support and resistance lines.
Because standard deviation measures dispersion from the average, price action reaching or exceeding the outer bands represents a statistical anomaly. Algorithmic strategies leverage these mathematical extremes to systematically evaluate whether price is overextended or initiating a volatility expansion phase.

Mean-Reversion Approach
A mean-reversion bot may look for price stretching outside the band and then returning inside it. This can work in range-bound conditions but can be dangerous during strong trends.
In a ranging environment, prices tend to oscillate predictably between the upper and lower bands. An automated script can trigger a buy order when price pierces below the lower band and closes back inside it, targeting a return toward the central moving average for a reliable profit taking zone.
However, during a strong breakout or news event, price can “walk the bands” for prolonged periods, causing unhedged mean-reversion bots to take repeated losing trades against the trend. To mitigate this, automated systems must incorporate trend-intensity filters to pause counter-trend entries when directional momentum is too high.
Breakout Approach
A breakout bot may watch for tight bands followed by a close beyond the upper or lower band. This attempts to capture expansion after compression.
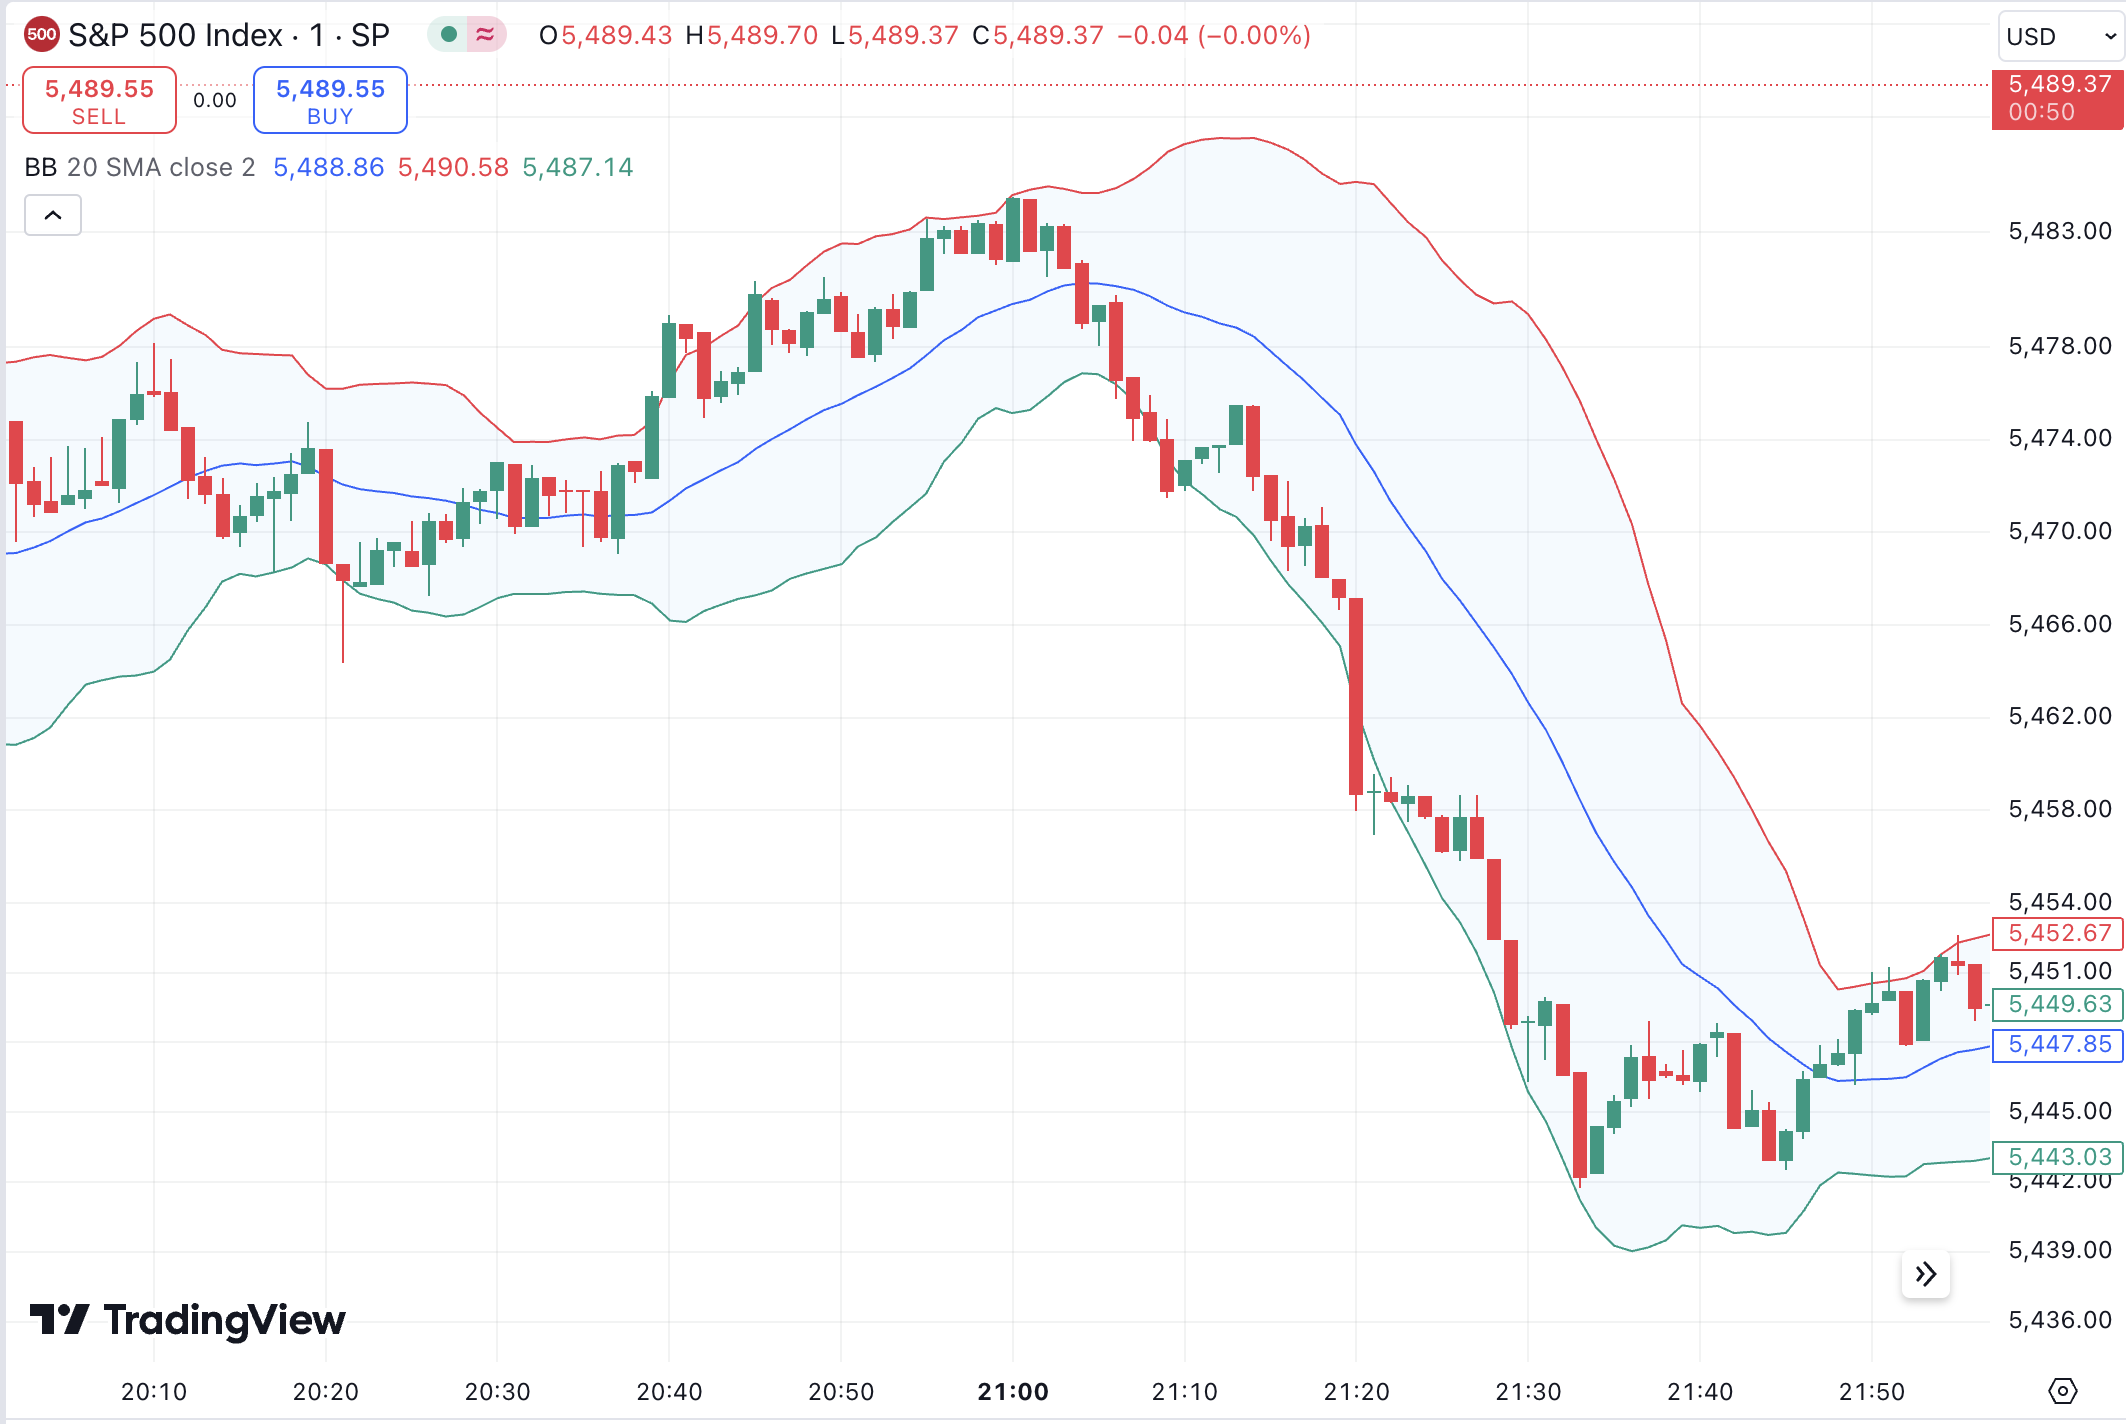
Periods of low volatility, often called a “Bollinger Squeeze,” reflect consolidation before a major structural move. Algorithmic strategies monitor the bandwidth metric specifically to detect when volatility drops to historical lows, preparing the execution engine to enter in the direction of the initial impulse.
Once a candle closes decisively outside the squeezed band, the bot enters the trade to ride the expanding volatility curve. To protect capital against false breakouts, algorithms often require a volume surge or trailing candle validation before confirming the entry signal.
Forex vs Crypto Differences
Forex pairs often have more stable volatility patterns than crypto. Crypto can move harder and faster, so bots may need wider stops, smaller position sizes, or stricter filters.
In traditional currency markets, mean-reversion strategies around Bollinger Bands tend to perform consistently due to central bank intervention ranges and institutional liquidity. Automated setups in forex can often utilize tighter standard deviation parameters (such as 2.0) and fixed risk multiples.
Conversely, digital assets regularly experience parabolic runs and violent flash crashes that blow straight through standard deviation envelopes. When configuring algorithms for crypto, broadening the bands to 2.5 or 3.0 standard deviations and implementing dynamic volatility-adjusted sizing helps absorb extreme market swings.
Adding Confirmation
Bollinger Band signals can be improved with volume, trend filters, RSI, or support and resistance. The goal is to avoid treating every touch of a band as a trade.
Combining Bollinger Bands with a momentum oscillator like RSI allows an automated system to confirm divergence before placing an order. For instance, if price touches the lower band while RSI displays a bullish divergence, the signal carries a significantly higher probability of success.
Additionally, layering a macro trend filter—such as requiring price to sit above the 200-period moving average—ensures the bot only executes long mean-reversion trades aligned with the broader market direction. Confluence-based execution weeds out market noise and preserves trading capital.
Risk Management Rules
Because band strategies can fail quickly in breakouts or reversals, every automated version should include a clear stop loss, maximum trade duration, and rules for avoiding duplicate entries.
Setting fixed or ATR-based stop losses beyond the swing high or low ensures that runaway trends do not inflict catastrophic drawdown on an account. Programmed risk logic can also automatically adjust position size based on the current distance between the bands, maintaining uniform monetary risk regardless of market volatility.
Time-based invalidation rules are equally important for automated trading setups. If a mean-reversion trade fails to progress toward the middle band within a set number of bars, the algorithm can close the position at market to free up capital and prevent exposure to changing market regimes.
Practical Example
Consider an automated mean-reversion strategy monitoring BTC/USDT on a 30-minute timeframe. The trading algorithm tracks a 20-period simple moving average with 2.5 standard deviation bands, supplemented by an hourly RSI filter and an automated profit-target engine.
When Bitcoin suffers a sharp sell-off, pushing price below the lower 2.5 standard deviation band while the 1-hour RSI remains above 35 (indicating no macro collapse), the bot flags a potential statistical stretch. As soon as a 30-minute bar closes back inside the lower band, confirming a rejection of extreme lower prices, the bot places a long position via exchange API.
The system automatically attaches a protective stop-loss just below the swing low and sets a primary profit target at the central 20-period moving average. If price reaches the middle band, the bot closes 70% of the position to lock in gains and trails the remaining lot size with a moving stop, executing the strategy systematically.
Common Mistakes Beginners Make
- Programming bots to buy every lower band touch without filtering for strong directional trends or high-impact economic events.
- Applying identical standard deviation settings to both forex and crypto markets despite vast differences in baseline volatility.
- Failing to implement time-based exit logic, leaving mean-reversion trades open while price consolidates indefinitely along the band.
- Over-leveraging accounts during tight bandwidth consolidation periods, leading to severe losses when explosive breakouts occur.
- Disregarding broker spreads and slippage during volatile breakout entries, which significantly degrades live execution performance.
How AlgoBot Can Fit Into the Workflow
AlgoBot eliminates the technical complexity of setting up Bollinger Band strategies by integrating dynamic volatility analysis into its core algorithmic framework. Instead of writing custom indicators or manually tracking bandwidth compression, traders access backtested strategies designed for both mean-reversion and breakout execution.
The platform’s decision engine automatically balances standard deviation boundaries against higher-timeframe trend baselines and momentum oscillators. This multi-layered processing guarantees that trade signals execute only when statistical probability and market confluence align.
Through seamless integrations with MetaTrader, webhook routing, and major crypto exchange APIs, AlgoBot translates complex Bollinger Band conditions into automated trade orders backed by strict risk parameters, dynamic position sizing, and automated profit targets.
Final Thoughts
Bollinger Bands Strategy for Forex and Crypto Bots is ultimately about structure. Traders do not need more random opinions; they need clear rules, consistent execution, and risk limits that protect them during bad conditions. Automation can help with that, especially when it is paired with education and realistic expectations.
For users comparing trading tools, the strongest platform is usually the one that makes disciplined behaviour easier: clear signals, sensible risk controls, transparent setup steps, and the ability to pause or adjust when conditions change. That is the standard beginners should use when evaluating AlgoBot or any other automated trading solution.
FAQs
Are Bollinger Bands better for breakout or reversal trading?
They can be used for either, but the rules must be designed for the chosen style.
What do tight bands mean?
Tight bands indicate low volatility and possible compression before a move.
Can a bot trade every band touch?
It should not. Band touches need context and risk controls.
Educational content only. Trading involves risk, and past or historical performance does not guarantee future results.