
 Share
Share


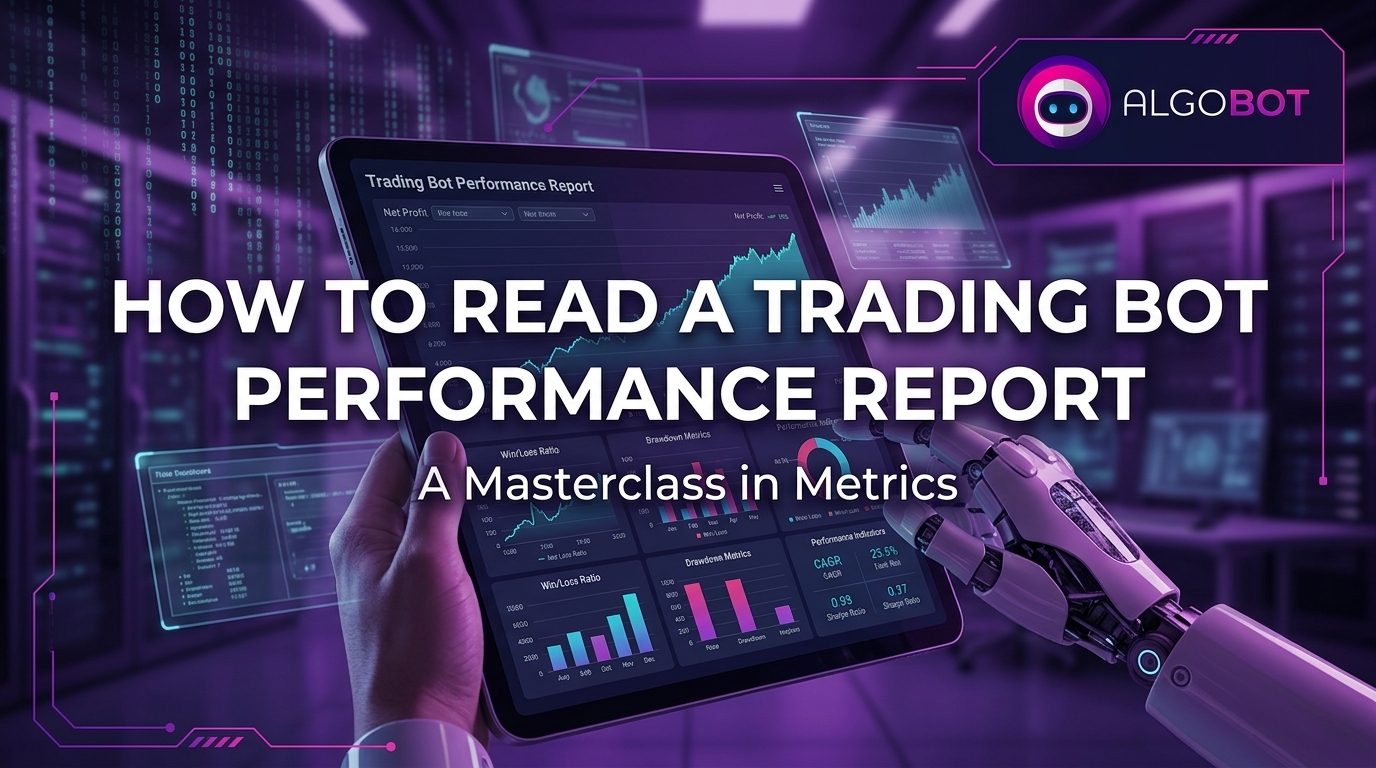
When evaluating an automated strategy, many traders make the critical mistake of focusing on a single headline metric: win rate. A high win rate can look impressive on a marketing page, but in algorithmic trading, it tells only a fraction of the story. A trading bot with an 80% win rate can still bankrupt an account if its few losing trades are five times larger than its average gains.
To determine whether an automated trading system possesses a genuine, sustainable edge, traders must know how to properly read and interpret a comprehensive performance report. Analyzing data from historical backtests or forward-testing logs requires looking beyond raw returns to evaluate risk exposure, drawdown recovery, and execution consistency.
Platforms like AlgoBot emphasize data-driven transparency, giving traders the exact performance metrics needed to evaluate, fine-tune, and deploy strategies with institutional discipline.
Key Takeaways
- Win rate alone is misleading; it must always be evaluated alongside the risk-reward ratio and average trade size.
- Key health metrics include Profit Factor, Maximum Drawdown (MDD), Recovery Factor, and total sample size.
- The shape of an equity curve reveals whether returns stem from a repeatable system or a few lucky outlier trades.
- Analyzing strategy performance across different market regimes (trending vs. range-bound) prevents unexpected live drawdowns.
- AlgoBot treats performance reports as functional diagnostic tools to validate strategy stability before committing real capital.
Core Metrics Every Quantitative Trader Must Analyze
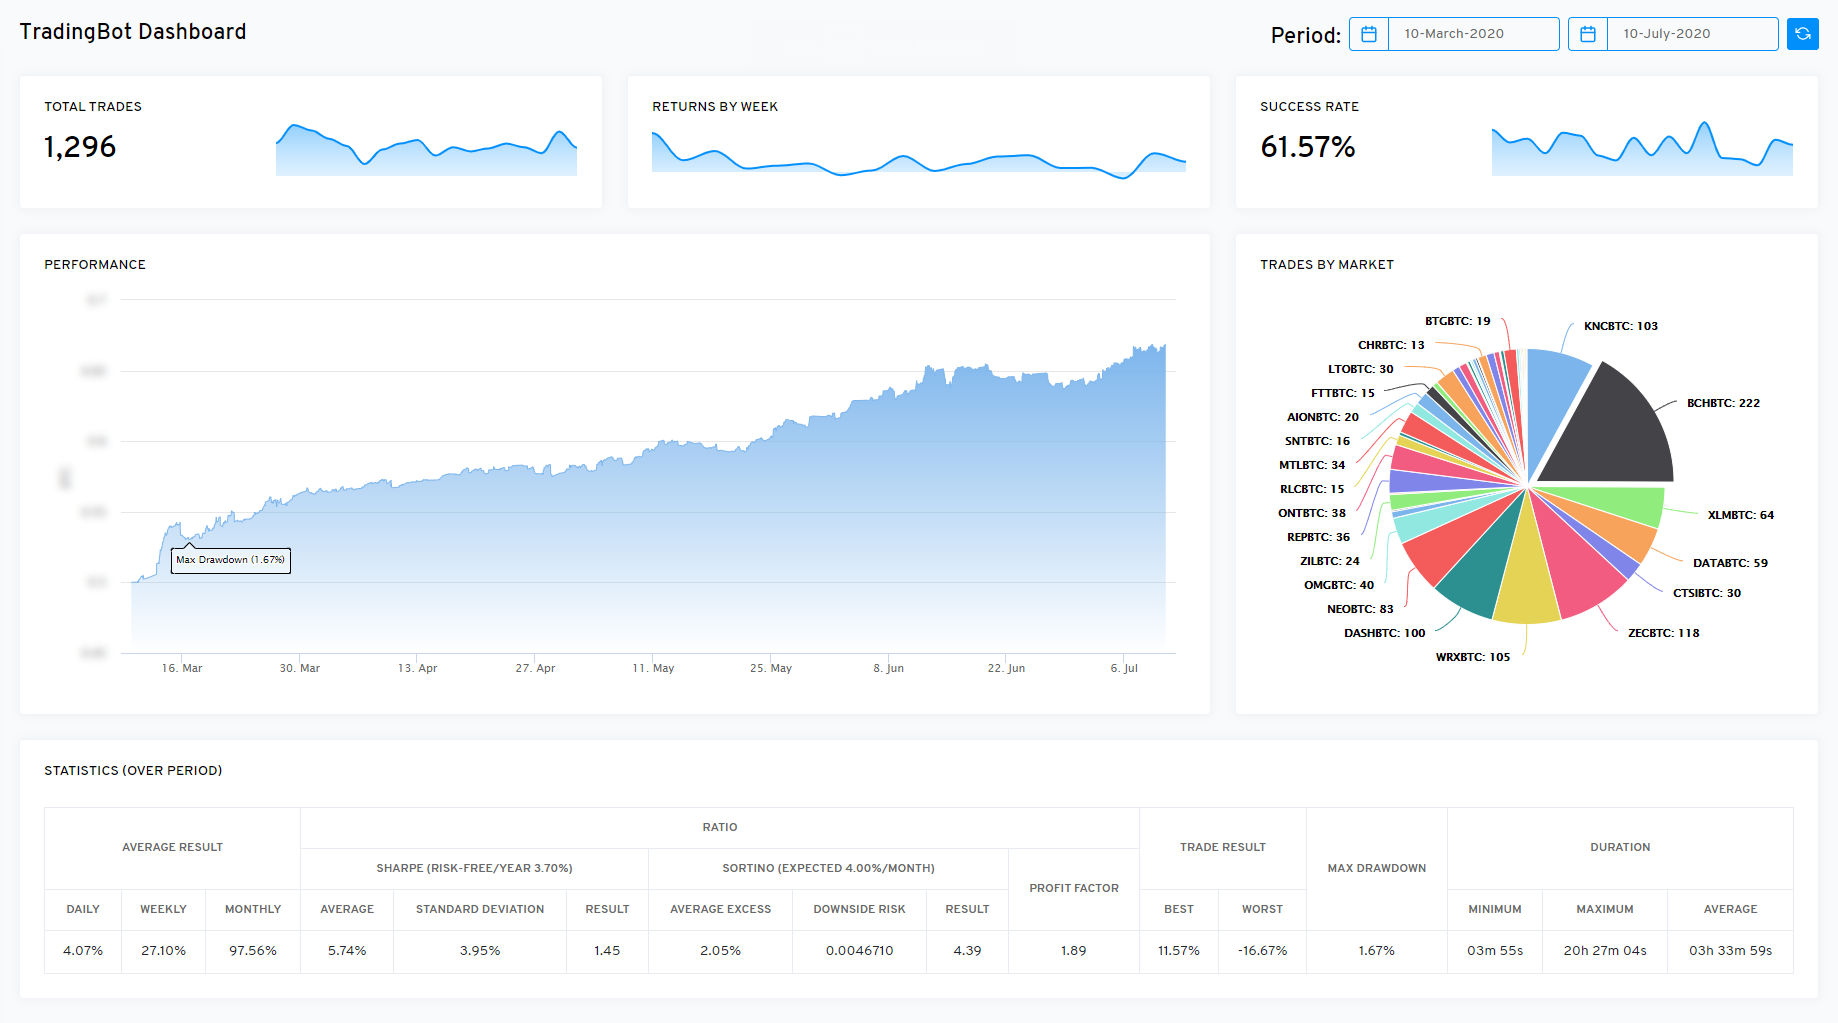
A comprehensive performance report translates hundreds of automated trades into quantifiable statistical outputs. To assess strategy health, examine these core metrics as an interconnected system rather than in isolation:
1. Total Return vs. Sample Size
Total return shows the cumulative percentage gain over a specified test period. However, return is meaningless without trade frequency context. Generating a 50% return over 15 trades is statistically irrelevant because it could be driven by random market luck. A statistically valid performance report requires a sample size of at least 100 to 200+ trades across changing market conditions.
2. Maximum Drawdown (MDD)
Maximum Drawdown measures the largest peak-to-trough decline in account equity, expressed as a percentage. If an account grows to $10,000 and subsequently drops to $8,000 before making new highs, the MDD is 20%. Understanding MDD helps traders set realistic expectations for normal capital fluctuations and set account kill-switches.
3. Profit Factor
Profit Factor is calculated by dividing gross profits by gross losses. It measures how effectively capital generates returns relative to risk:
$$\text{Profit Factor} = \frac{\text{Gross Profits}}{\text{Gross Losses}}$$
A profit factor below 1.0 means the strategy is losing money. A range between 1.5 and 2.0 indicates a healthy, sustainable system. Be cautious of backtested profit factors above 3.0, as they frequently point to over-optimized or curve-fitted parameters that will degrade in live markets.
4. Risk-Reward Ratio (RRR) and Expectancy
Risk-Reward Ratio measures the average size of winning trades compared to losing trades. Combine RRR with win rate to calculate mathematical Expectancy—the average amount you can expect to win or lose per dollar risked:
Expectancy Equation:
Expectancy = (Win Rate × Average Win) − (Loss Rate × Average Loss)
Comparing Key Performance Metrics
The table below details benchmark target values and common red flags when reading bot performance reports:
| Metric Name | What It Measures | Healthy Benchmark Target | Warning Sign / Red Flag |
|---|---|---|---|
| Win Rate | Percentage of winning trades | 40% – 65% (depends on RRR) | >85% (often hides martingale or unlimited stop-loss risk) |
| Profit Factor | Gross Profits / Gross Losses | 1.50 – 2.20 | <1.10 (thin edge) or >3.50 (curve-fitted) |
| Max Drawdown | Largest peak-to-trough capital decline | 10% – 20% | Drawdown exceeds total expected annual return |
| Max Consecutive Losses | Longest sequence of losing trades | 4 – 7 consecutive trades | 10+ losing streak without dynamic risk recovery |
Evaluating Equity Curves and Market Regimes
Beyond numbers, visual charts provide instant feedback on bot behavior. The equity curve tracks overall account balance growth over time.
A smooth, upward-sloping line angle indicates consistency. A jagged curve with massive spikes followed by steep drops indicates a strategy reliant on high leverage or wide stops. Likewise, watch out for “stair-step” curves where total gains depend on one or two isolated trades during an extreme event.
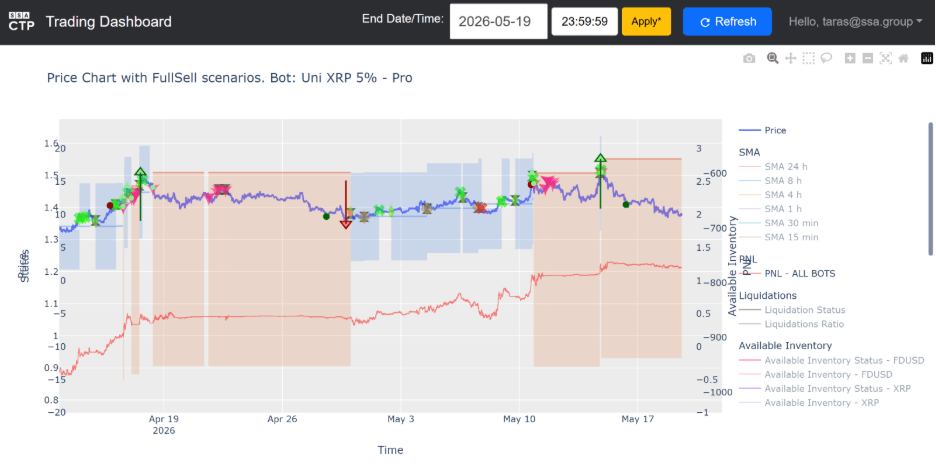
Additionally, review how the bot performs across different market regimes:
- Trending Regimes: Does a trend-following bot give back all gains when price moves sideways?
- Ranging Regimes: Does a mean-reversion algorithm get wiped out when a strong breakout occurs?
- Volatility Spikes: How does trade entry and stop loss behavior respond during economic news releases?
Common Performance Reading Errors
- Over-Emphasizing High Win Rates: Ignoring negative risk-reward ratios where a single loss wipes out five previous wins.
- Ignoring Trade Duration: Scalping algorithms with brief holding times ($<1$ minute) look great in backtests, but collapse in real execution due to live spreads and slippage.
- Ignoring Commission and Swap Fees: Evaluating gross returns without deducting spread markups, overnight financing rates, or broker commissions.
- Short Testing Windows: Testing a bot only during a strong bull market and expecting identical performance during bear regimes.
How AlgoBot Enhances Strategy Diagnostics
AlgoBot converts raw trade logs into actionable visual insights. Rather than forcing you to sort through dense, unstructured CSV files, AlgoBot automatically calculates Profit Factor, Expectancy, Max Drawdown, and Win Rate metrics in real time.
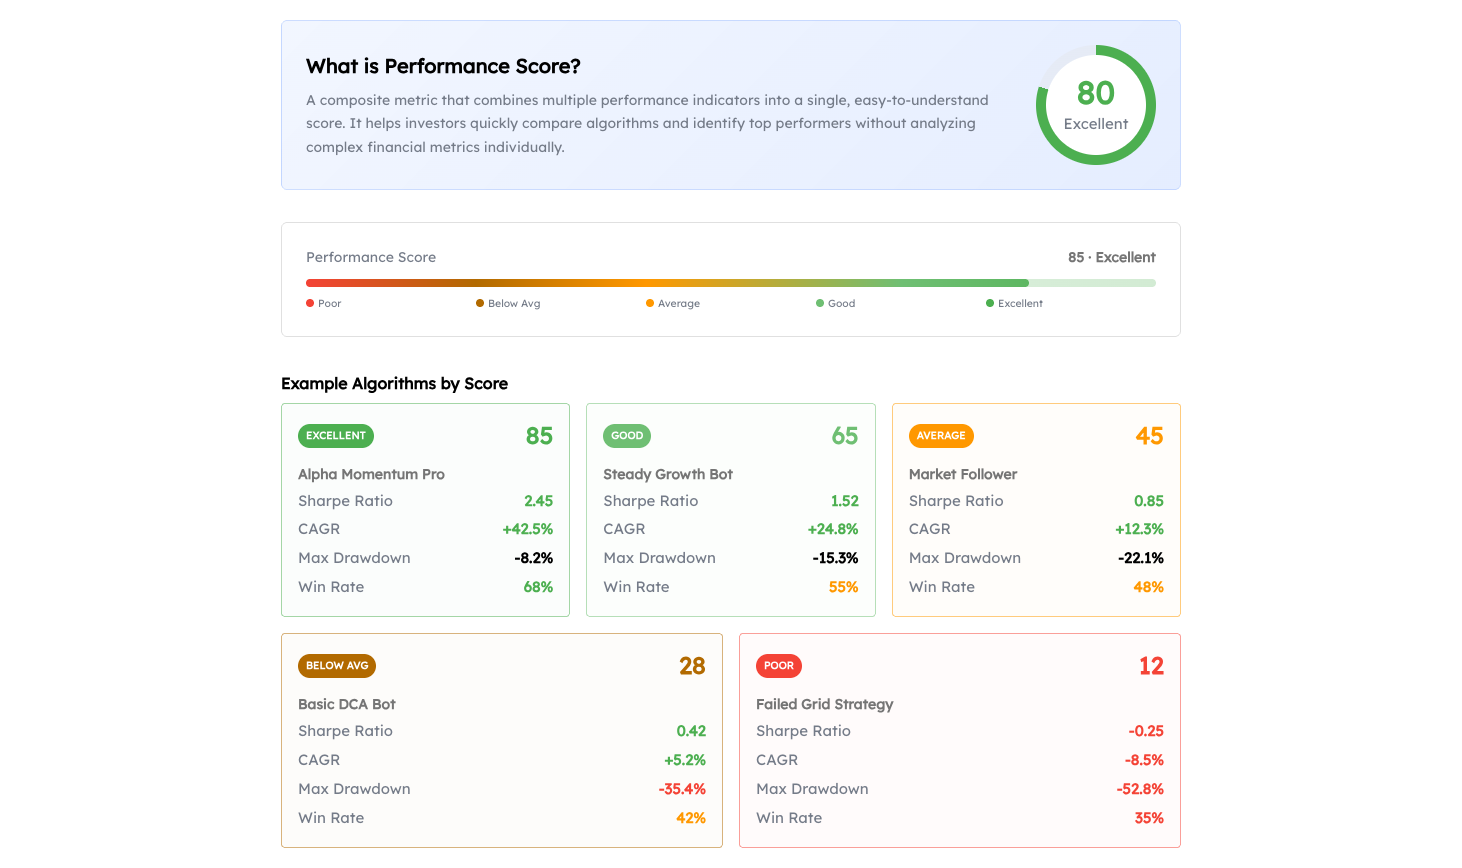
By connecting custom rules to MetaTrader, TradingView, or exchange APIs, AlgoBot allows you to analyze equity curves, evaluate performance across market conditions, and deploy pre-engineered risk parameters with confidence.
Final Thoughts
Reading a trading bot performance report is about understanding equity stability and structural risk. A high win rate is meaningless without contextual risk controls, dynamic stop losses, and verified performance history across multiple market cycles.
By assessing Profit Factor, Drawdown, Expectancy, and visual equity curves, traders transform raw data into an objective execution roadmap—ensuring every strategy is built to handle real market risks.
FAQs
What is a good Profit Factor for a trading bot?
A Profit Factor between 1.5 and 2.0 indicates a healthy, reliable trading bot. Anything below 1.0 is unprofitable, while numbers above 3.0 often point to backtest curve-fitting.
Why is Maximum Drawdown more important than total returns?
Maximum Drawdown shows the worst peak-to-trough capital loss. A bot making 100% returns is unusable if it experiences an 80% drawdown that risks blowing up the account along the way.
How many trades do I need for a valid performance report?
A minimum sample size of 100 to 200 trades is recommended across various market regimes to ensure your statistical metrics are robust and statistically significant.
Educational content only. Trading involves risk, and past or historical performance does not guarantee future results.