


 Share
Share


The Moving Average Convergence Divergence (MACD) is one of the most reliable momentum and trend-following indicators utilized in algorithmic trading systems. Developed to measure the relationship between two exponential moving averages, MACD provides automated trading bots with objective mathematical values to gauge market direction, acceleration, and trend exhaustion.
Platforms like AlgoBot integrate MACD signal logic into multi-layered decision pipelines, allowing traders to systematically capture momentum shifts across forex, crypto, and commodity markets. By combining MACD line crossovers with histogram rate-of-change analysis and dynamic risk parameters, traders can establish repeatable execution workflows without emotional intervention.
However, because MACD relies on historical price data, it is inherently a lagging indicator susceptible to whipsaws during low-volatility consolidation phases. Pairing MACD crossover logic with macro trend filters—such as long-term moving averages—and dynamic volatility-based stop losses ensures that automated systems remain protected against ranging market noise.
Key Takeaways
- MACD calculates the distance between fast and slow exponential moving averages, providing objective momentum metrics for automated systems.
- Signal line crossovers offer clear algorithmic entry triggers, but require zero-line or volatility filters to avoid whipsaws in ranging markets.
- Histogram expansion and contraction allow trading bots to detect momentum acceleration or divergence prior to price trend reversals.
- Incorporating a long-term trend baseline (such as the 200 EMA) prevents algorithms from taking low-probability counter-trend trades.
- AlgoBot combines backtested MACD logic with automated risk management and multi-timeframe validation to execute disciplined trade setups.
What MACD Shows
MACD is a momentum indicator built from moving averages. It usually includes the MACD line, signal line, and histogram. Traders use it to assess whether momentum is strengthening or weakening.
By measuring the relationship between two exponential moving averages—typically the 12-period and 26-period EMAs—it provides a clear visual representation of market velocity. In algorithmic setups, these numerical outputs give trading bots distinct mathematical triggers to evaluate whether a trend is gaining traction or running out of steam.
Because it combines trend-following properties with momentum measurement, it functions effectively across multiple asset classes. However, traders must account for its lagging nature, as moving averages are calculated from historical price data rather than future projections.
Crossover Strategy
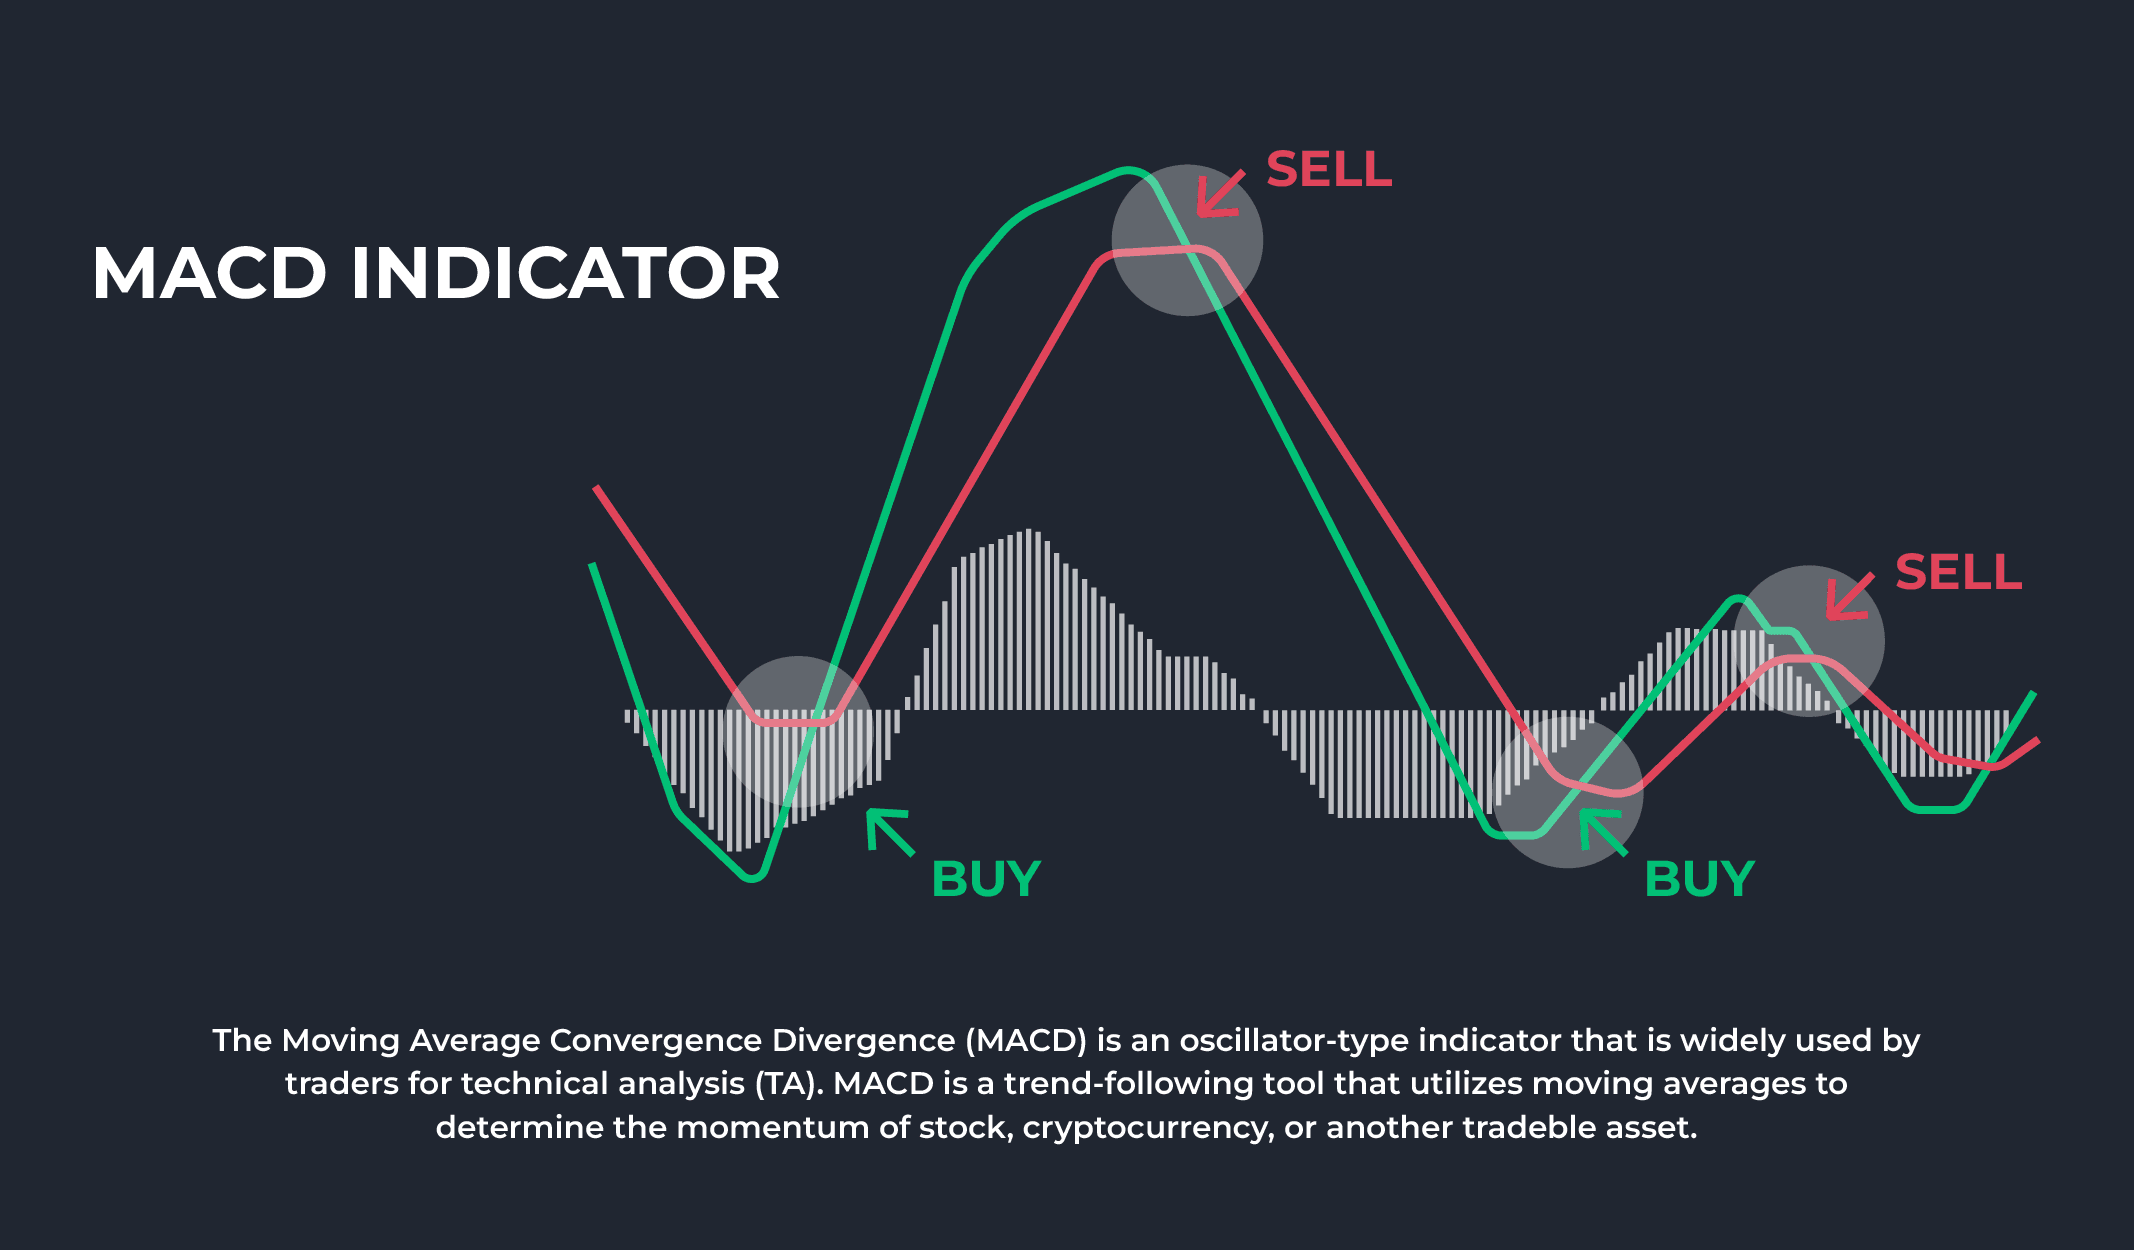
A common automated rule is to buy when the MACD line crosses above the signal line and sell when it crosses below. This is simple to code, but it can produce false signals in sideways markets.
During prolonged consolidation phases, the MACD and signal lines often weave back and forth tightly, causing bots to execute repetitive, unprofitable trades. This “whipsaw” effect can quickly erode an account balance if additional conditions are not applied to validate the strength of the crossover.
To make crossover strategies more reliable in automated systems, traders frequently require the signal to occur at a specific distance from the zero line. Adding a volume spike or candlestick confirmation rule before firing the execution signal also helps weed out weak setups.
Histogram Strategy
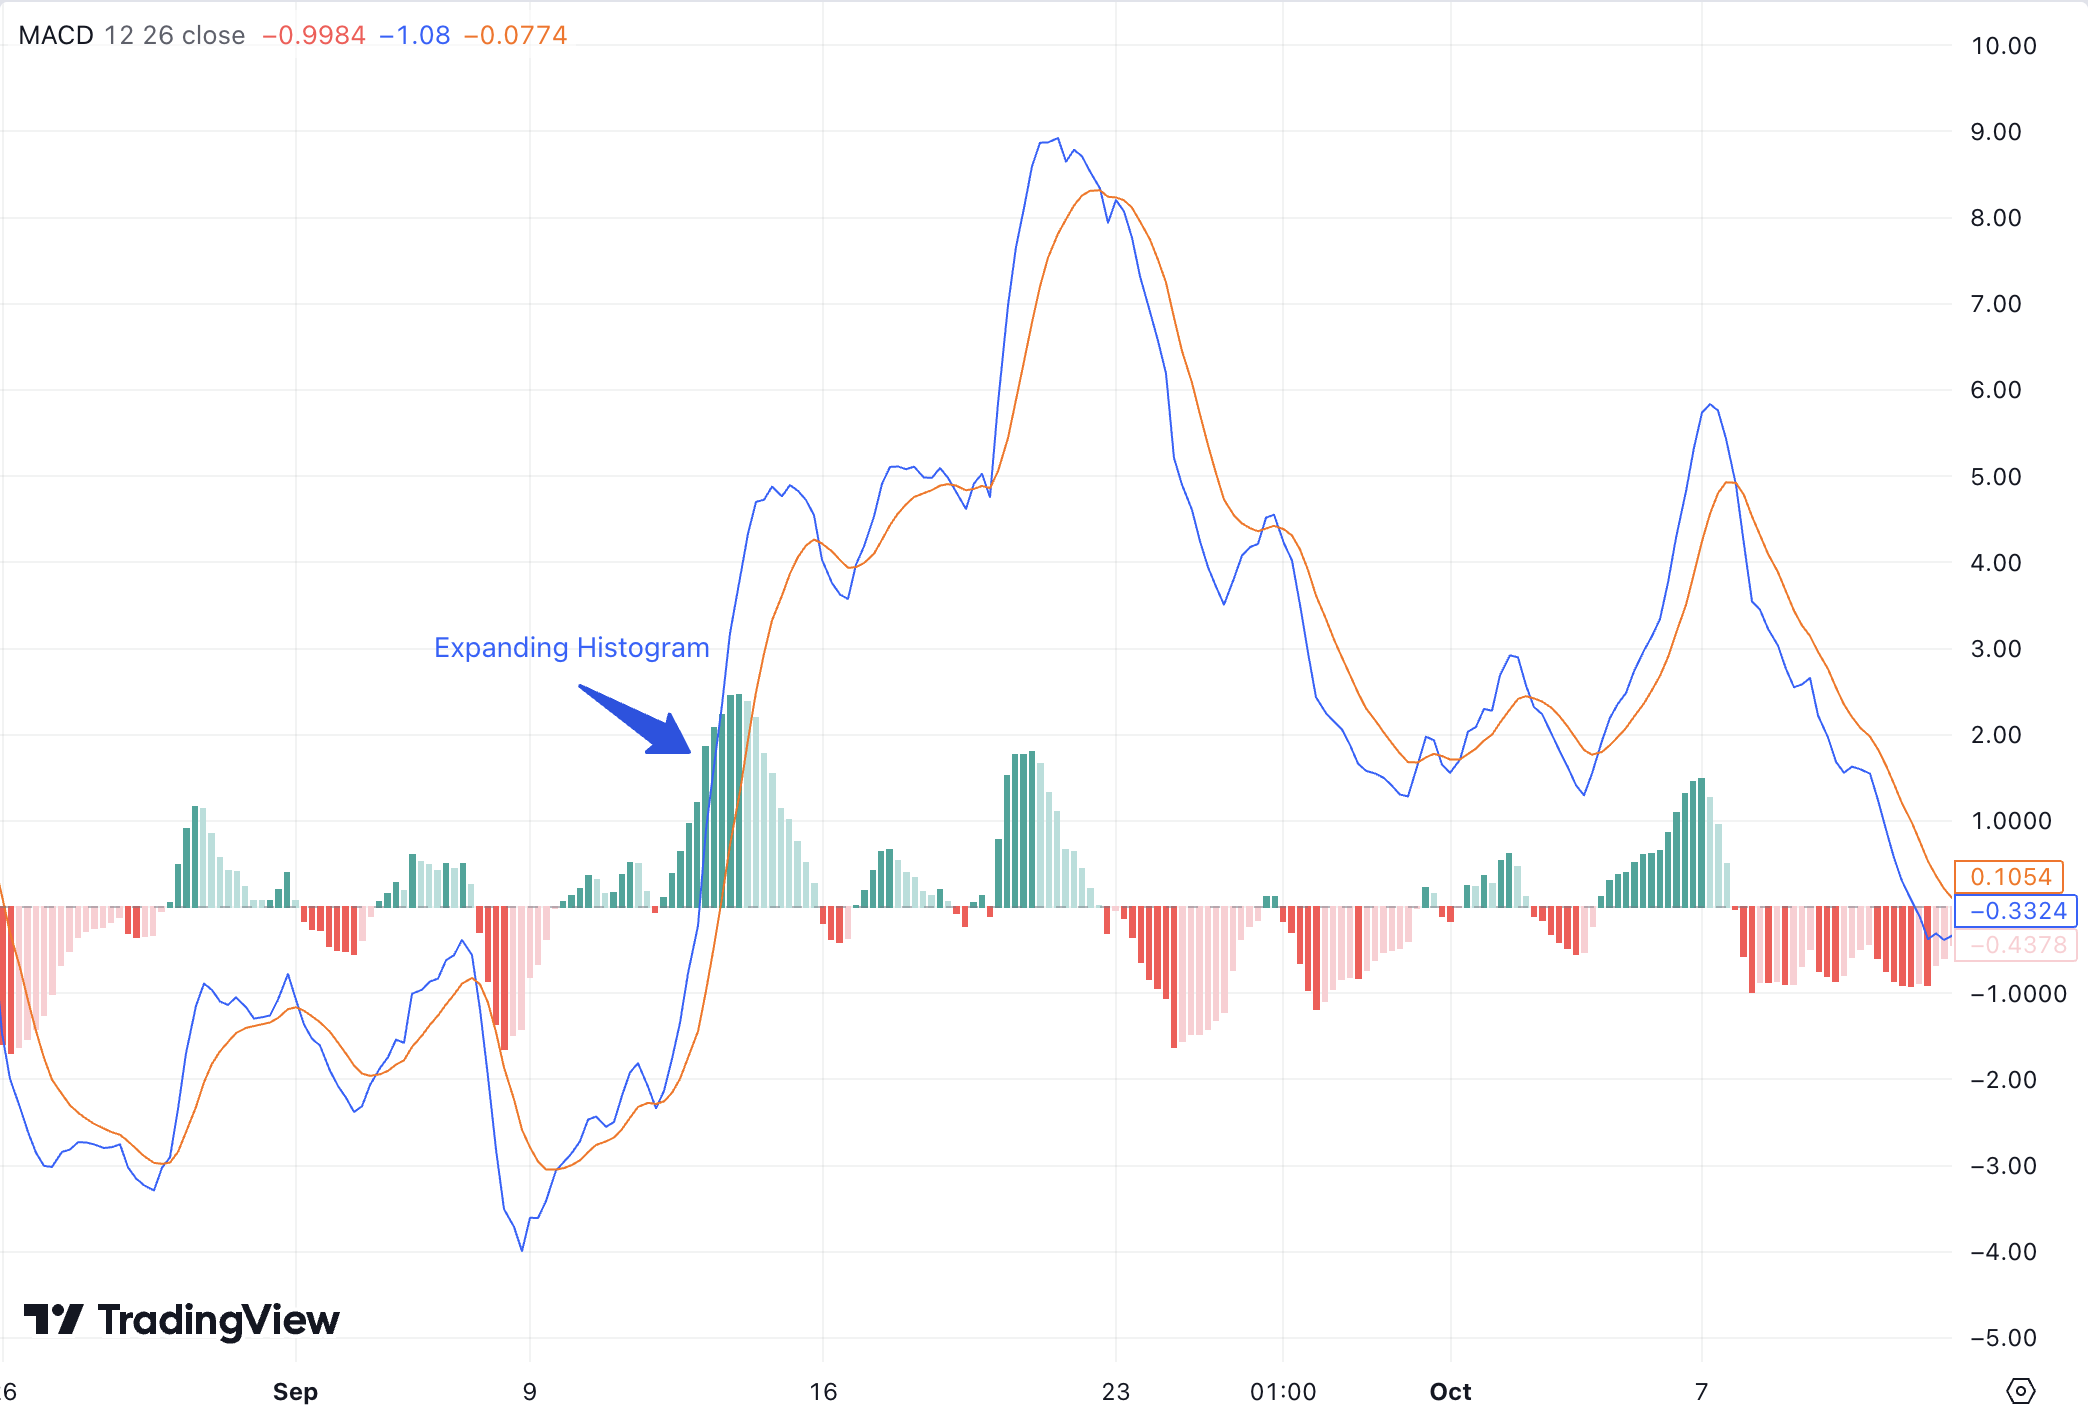
The histogram shows the distance between MACD and its signal line. A growing histogram can indicate momentum expansion, while a shrinking histogram can warn that a move is losing energy.
For algorithmic strategies, tracking the rate of change in the histogram bars allows bots to spot momentum shifts before an actual line crossover occurs. A bot might be programmed to scale into a position or prepare for an exit as soon as the histogram bars begin slope reversal for two consecutive periods.
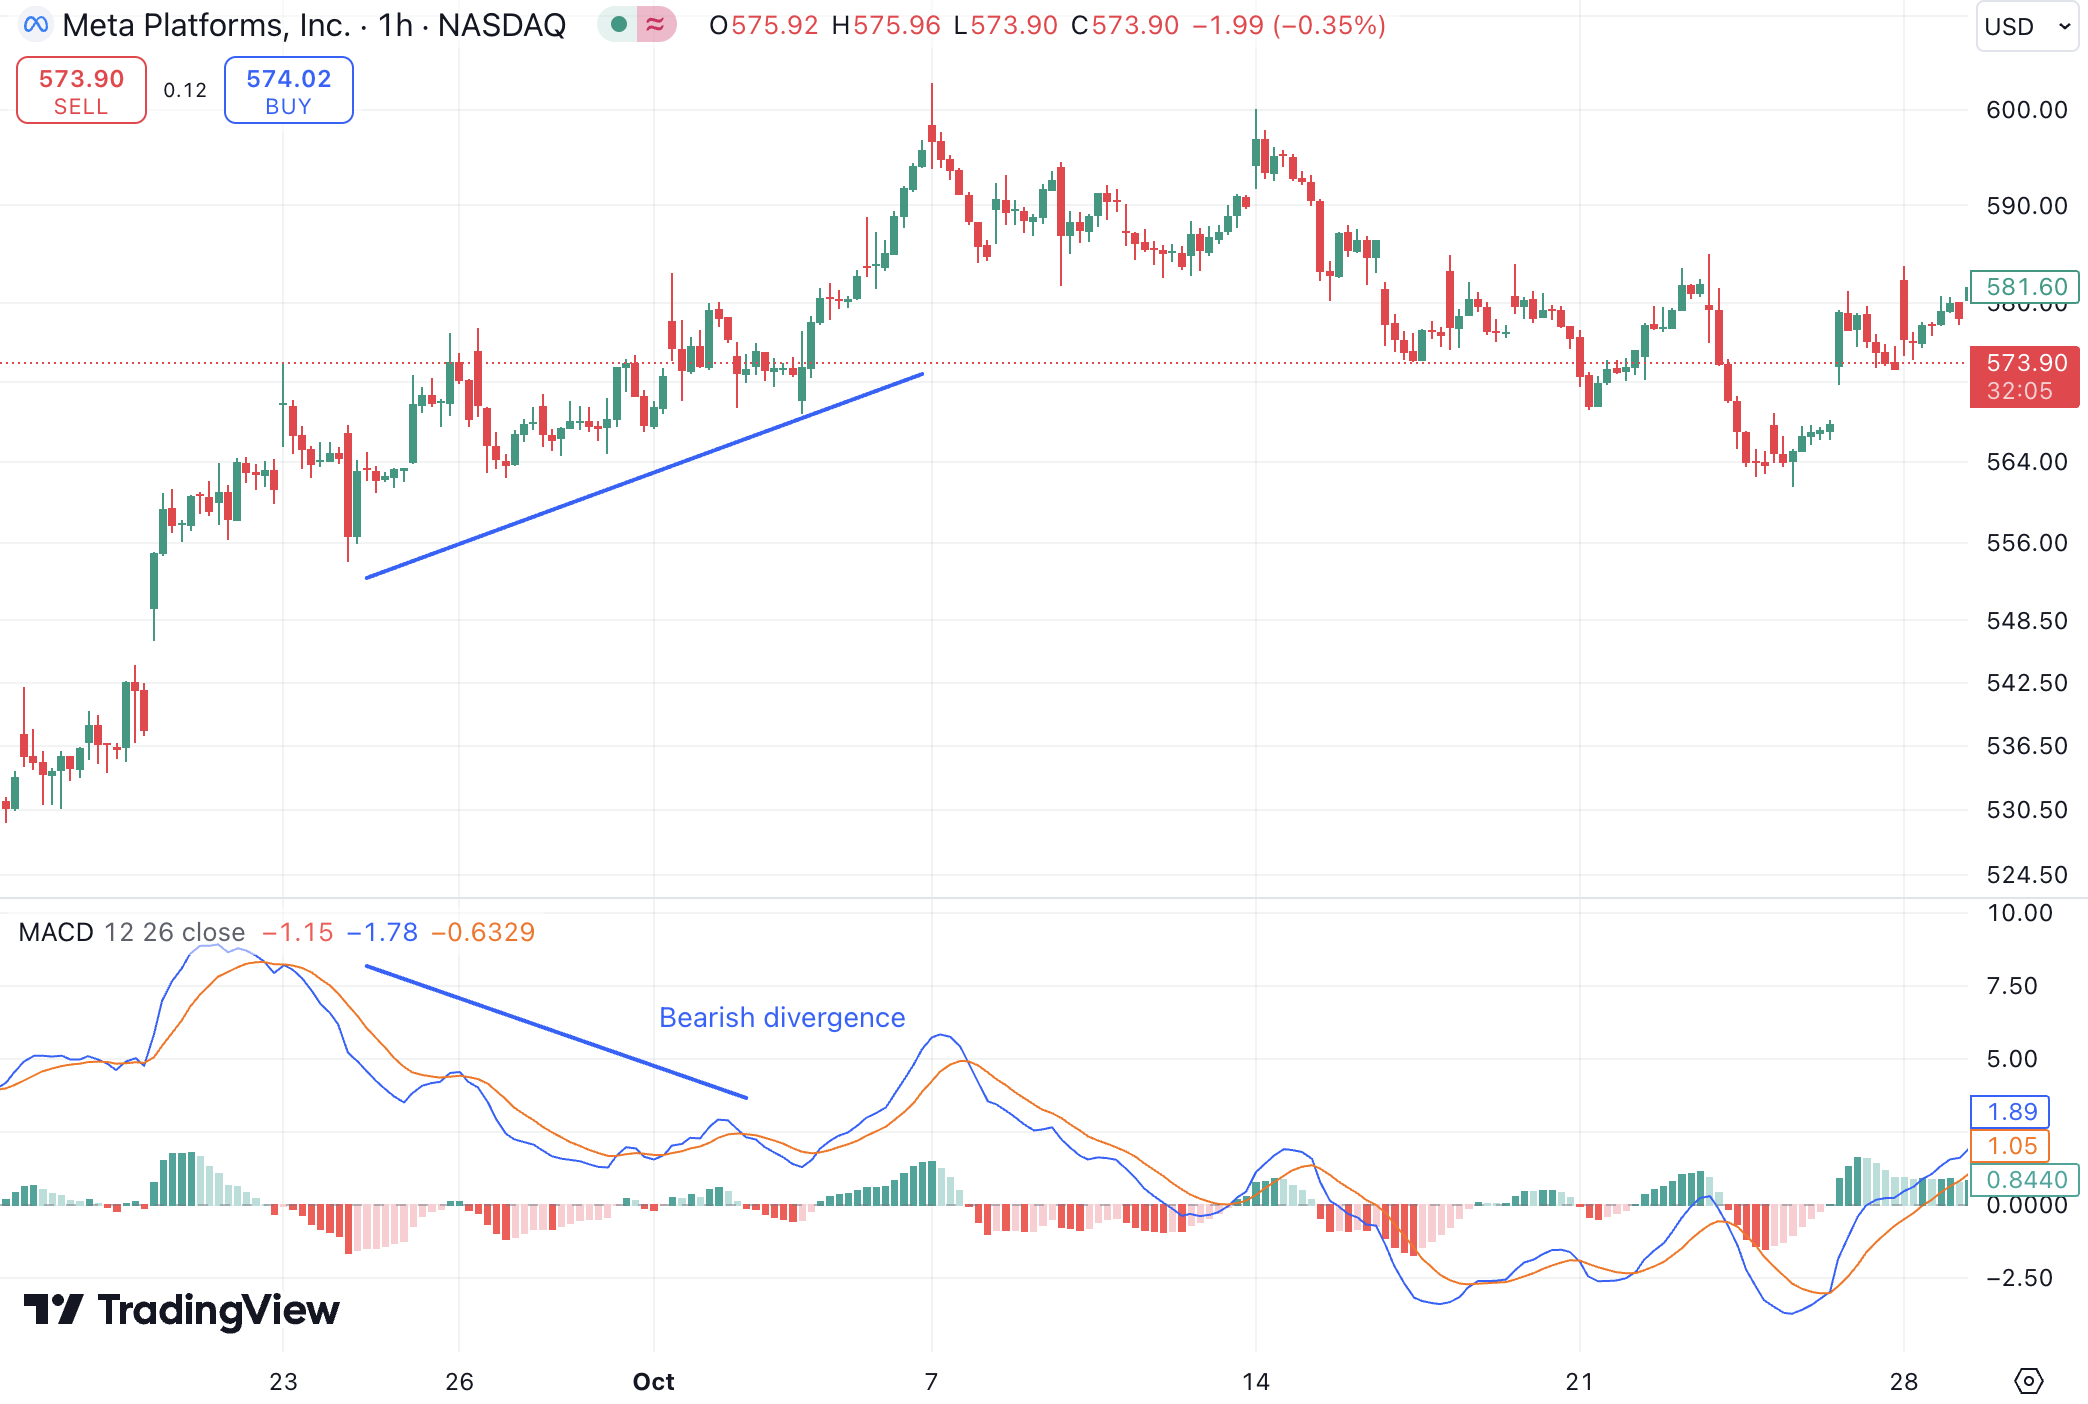
Histogram logic is particularly useful for identifying momentum divergence against price action. When price makes a higher high but the MACD histogram forms a lower high, an automated system can flag an impending reversal or automatically tighten trailing stop-loss orders.
Using MACD With Trend Filters
A bot can improve MACD logic by only taking bullish crosses when price is above a longer-term moving average, or bearish crosses when price is below it. This avoids fighting the dominant trend.
Integrating a macro filter, such as a 200-period Simple Moving Average (SMA), ensures that long trades are only taken during structural bull trends and shorts during bear trends. Filtering signals this way drastically reduces low-probability counter-trend trades during chop.
Additionally, bots can incorporate time-frame alignment by requiring higher timeframe trend agreement before validating a lower timeframe MACD signal. This multi-timeframe confluence provides a much sturdier foundation for automated execution models.
Stop Loss and Take Profit
MACD does not define risk by itself. An automated strategy still needs stop-loss placement, target logic, and invalidation rules. ATR-based stops are one way to adapt risk to volatility.
Using the Average True Range (ATR) allows stop distances to dynamically expand during turbulent market conditions and contract during calm regimes. This prevents market noise from prematurely stopping out a trade while keeping risk strictly controlled relative to current market behavior.
For profit targets, combining fixed risk-to-reward ratios with trailing stop triggers helps lock in gains as the trend develops. An automated rule might move the stop loss to breakeven once price reaches a 1:1 risk-reward milestone, protecting trading capital as price moves toward primary targets.
Testing Before Automation
MACD strategies should be backtested across trending and range-bound periods. A strategy that performs only in strong trends may need a range filter or a rule that pauses during low volatility.
Simulating rule performance over historical market cycles highlights maximum drawdown periods and win-rate stability across changing market conditions. Robust backtesting reveals whether parameters are curve-fitted to past noise or genuinely resilient enough for forward live markets.
Before deploying real capital, running the strategy on a demo account or in a forward-testing environment confirms that execution speed, slippage, and broker spreads match backtest assumptions. This final validation step prevents unexpected performance discrepancies during live execution.
Practical Example
Consider an automated MACD trading algorithm scanning the GBP/USD 1-hour timeframe during active market hours. The bot is configured with standard 12, 26, 9 EMA parameters alongside a 200-period EMA macro filter and an ATR-based risk control module.
When the fast MACD line crosses above the signal line below the zero line, the bot first verifies that GBP/USD is trading above the 200 EMA to ensure alignment with the broader bullish trend. Next, it checks that the MACD histogram has expanded positively for two consecutive bars to confirm momentum acceleration.
Once all criteria evaluate as true, the algorithm routes a buy order to the broker via API. It sets an initial stop-loss at 1.5 times ATR below entry and targets a 2:1 risk-to-reward ratio, while programming an automated trailing stop to lock in partial gains as the MACD histogram begins to contract.
Common Mistakes Beginners Make
- Executing live MACD crossover trades during tight range-bound market consolidation, resulting in severe whipsaw losses.
- Relying solely on MACD crossovers without incorporating macro trend filters or baseline support and resistance validation.
- Failing to dynamically adjust stop-loss placement for market volatility, leading to prematurely stopped-out trades during news events.
- Curve-fitting EMA period settings to historical noise rather than utilizing standardized, backtested indicator parameters.
- Neglecting position sizing rules and risking too much account equity on individual momentum signals.
How AlgoBot Can Fit Into the Workflow
AlgoBot streamlines the deployment of MACD trading strategies by embedding advanced momentum and trend logic directly into its automated signal architecture. Rather than writing custom indicator code or managing manual trade entries, traders leverage AlgoBot’s pre-engineered systems to capture momentum setups automatically.
The platform’s decision engine evaluates MACD crossovers, histogram rate of change, and multi-timeframe trends simultaneously. This ensures that generated signals satisfy strict technical confluence before transmitting orders directly to MetaTrader, webhooks, or crypto exchange APIs.
In addition to trade entry precision, AlgoBot enforces disciplined account management with automated position sizing, dynamic stop-loss calculations, and multi-tier take-profit tracking, providing a complete framework for automated trading across diverse financial markets.
Final Thoughts
MACD Trading Strategy for Algorithmic Trading is ultimately about structure. Traders do not need more random opinions; they need clear rules, consistent execution, and risk limits that protect them during bad conditions. Automation can help with that, especially when it is paired with education and realistic expectations.
For users comparing trading tools, the strongest platform is usually the one that makes disciplined behaviour easier: clear signals, sensible risk controls, transparent setup steps, and the ability to pause or adjust when conditions change. That is the standard beginners should use when evaluating AlgoBot or any other automated trading solution.
FAQs
Is MACD good for bots?
It can be useful because it creates clear rule-based signals, but it should not be used alone.
What is the main weakness of MACD?
MACD can lag because it is based on moving averages.
Can MACD be used for crypto too?
Yes, but crypto volatility may require different stops and filters.
Educational content only. Trading involves risk, and past or historical performance does not guarantee future results.