

 Share
Share


Technical indicators form the structural foundation of automated forex trading algorithms, translating raw price action, volume, and volatility into actionable digital parameters. Because trading bots operate purely on mathematical logic, technical indicators provide the objective thresholds required to identify high-probability setups without human emotional bias.
Platforms like AlgoBot utilize multi-indicator confluence models—combining trend, momentum, and volatility readings—to generate robust trading signals. Understanding how individual indicators function within an automated environment allows traders to construct balanced execution strategies while avoiding common pitfalls like indicator redundancy and curve-fitting.
No single technical indicator can perform effectively across all market regimes. By combining complementary technical tools into a multi-layered filtering pipeline, automated trading systems can filter out market noise, confirm directional strength, and maintain strict risk parameters during changing market conditions.
Key Takeaways
- Technical indicators provide automated algorithms with objective, quantifiable rules for identifying market entry and exit conditions.
- Relying on a single indicator creates vulnerability to false signals, as individual tools perform differently in trending versus ranging markets.
- Combining trend-following indicators like Moving Averages with momentum oscillators like RSI creates balanced multi-indicator confluence.
- Volatility filters like Bollinger Bands allow automated bots to adjust position sizing and stop distances dynamically during market expansion.
- AlgoBot leverages multi-layered algorithmic analysis to ensure trade orders execute only when trend, momentum, and volatility align.
Why Indicators Matter in Automation
Indicators convert price and volume information into structured readings. Automated systems need structure because they cannot rely on vague judgement. Indicators give bots a way to define trend, momentum, volatility, and mean reversion.
By translating complex raw chart data into clear mathematical values, indicators provide the objective inputs that trading algorithms require to make decisions. They eliminate subjective interpretation, allowing automated strategies to evaluate market conditions systematically across multiple timeframes.
In an algorithmic setup, indicators serve as precise boolean logic gates (e.g., IF RSI < 30 AND EMA 50 > EMA 200). This clear logic allows trading software to evaluate thousands of market ticks per second and execute orders instantaneously as soon as defined parameters are satisfied.
Moving Averages
Moving averages help identify trend direction and dynamic support or resistance. A bot might use a fast moving average crossing above a slow moving average as a bullish signal, or use price above a long-term average as a trend filter.
Because moving averages smooth out short-term price noise, they are ideal for keeping automated systems aligned with the dominant market direction. Incorporating dynamic baseline levels helps bots avoid taking counter-trend positions during strong, persistent directional moves.
Standard exponential moving average (EMA) combinations, such as the 20-period and 50-period EMAs, are widely used in algorithmic trend-following strategies. When used as a directional macro filter (such as restricting longs to prices above the 200 EMA), moving averages significantly boost overall system accuracy.
RSI
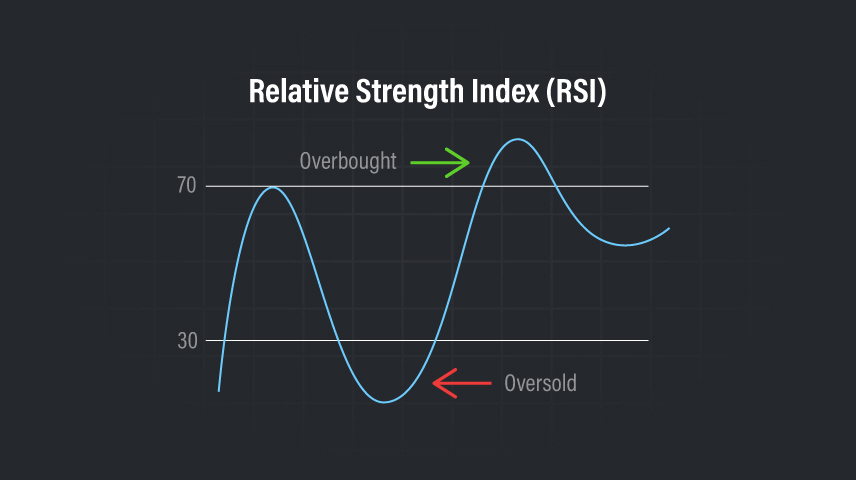
The Relative Strength Index measures momentum and overbought or oversold conditions. Automated systems can use RSI to avoid buying after extreme rallies or to identify possible reversal areas.
When programmed into trading bots, RSI thresholds act as objective boundaries that can trigger entry or exit rules automatically. Beyond simple overbought and oversold levels, bots can also track RSI divergences to anticipate weakening momentum before price turns.
Algorithmic implementations of RSI often integrate dynamic multi-timeframe checks to prevent false readings. For instance, a bot can verify that an hourly RSI bounce aligns with a daily momentum trend, preventing premature counter-trend positions during strong market runs.
MACD

MACD combines trend and momentum. It can help a bot detect when momentum is accelerating or fading. Crossovers and histogram changes are common automation triggers.
By evaluating the relationship between two exponential moving averages, the indicator offers early signals when market speed shifts. Automated strategies often use histogram expansion or baseline crosses as secondary confirmation to ensure trades are entered only when momentum supports the move.
In automated setups, the MACD signal line crossover is frequently combined with volatility filters to confirm trade strength. By measuring the rate of histogram change, trading bots can detect momentum shifts early and adjust trailing stops to protect unrealized profits.
Bollinger Bands

Bollinger Bands measure volatility around a moving average. They can be used for breakout systems, mean-reversion systems, or volatility filters.
The dynamic widening and narrowing of the bands allows automated algorithms to adapt instantly to changing market volatility. Bots can scan for price touches on outer bands to trade mean-reversion setups during range-bound conditions, or detect band squeezes to prepare for upcoming explosive volatility breakouts.
By calculating standard deviation shifts around the central moving average, Bollinger Bands help trading algorithms establish dynamic risk boundaries. Automated bots use these expanding or contracting channels to adjust stop-loss distances and take-profit targets relative to current market volatility.
Why Combining Indicators Helps
No indicator works in every market. A stronger bot often combines trend, momentum, volatility, and risk filters rather than relying on one reading. The aim is confirmation, not clutter.
Layering complementary indicators creates a multi-layered filter that significantly reduces costly false signals. By requiring confluence across trend direction, momentum validation, and volatility boundaries, an automated workflow ensures that orders execute only when high-probability alignment is achieved.
However, automated systems must avoid indicator redundancy—such as layering three momentum oscillators that measure the same underlying data. A properly engineered automated stack selects one tool per category (Trend, Momentum, Volatility) to build an efficient decision matrix without over-complicating system code.
Practical Example
Consider an automated breakout strategy executing on the EUR/USD 1-hour timeframe. Rather than relying solely on a price cross above a high period moving average, the automated bot requires a multi-indicator confirmation matrix prior to submitting an order to the broker terminal.
First, the bot checks that price is trading above the 200 EMA to establish macro bullish trend bias. Second, it requires the MACD histogram to be expanding above its baseline to confirm momentum acceleration. Third, it verifies that price has expanded beyond the upper Bollinger Band, confirming a true volatility breakout.
If all three mathematical conditions evaluate as true simultaneously, the bot executes a long position instantly via API, placing an automated stop-loss at the lower Bollinger Band. If any single condition fails, the bot stands aside, demonstrating the value of multi-indicator filtering.
Common Mistakes Beginners Make
- Combining multiple indicators from the exact same category (such as RSI and Stochastic), causing indicator redundancy without adding new analytical value.
- Over-optimizing indicator period settings on historical data (curve-fitting), leading to poor performance during real-time live trading.
- Failing to incorporate volatility filters, causing automated strategies to over-trade during low-volume market consolidation phases.
- Ignoring higher-timeframe trend context when configuring short-term indicator crossover triggers inside trading bots.
- Using fixed, static indicator threshold values without adjusting for changing market regimes and sudden volatility spikes.
How AlgoBot Can Fit Into the Workflow
AlgoBot abstracts the complexity of indicator programming by integrating a pre-engineered multi-indicator decision engine into its core logic. Instead of manually coding, backtesting, and balancing individual indicators, traders gain access to optimized algorithms that combine trend, momentum, and volatility analysis automatically.
By synthesizing input data from multiple technical tools behind the scenes, AlgoBot generates clean, high-confluence trading signals. This eliminates the noise of conflicting indicator readings while enforcing strict automated risk controls—such as dynamic stop-loss positioning and risk-based lot sizing.
Whether routing trades via MetaTrader terminals, webhook connectors, or exchange APIs, AlgoBot ensures that technical indicator signals translate into disciplined broker execution, helping traders maintain a rule-based trading pipeline across forex and crypto markets.
Final Thoughts
Best Forex Indicators for Automated Trading is ultimately about structure. Traders do not need more random opinions; they need clear rules, consistent execution, and risk limits that protect them during bad conditions. Automation can help with that, especially when it is paired with education and realistic expectations.
For users comparing trading tools, the strongest platform is usually the one that makes disciplined behaviour easier: clear signals, sensible risk controls, transparent setup steps, and the ability to pause or adjust when conditions change. That is the standard beginners should use when evaluating AlgoBot or any other automated trading solution.
FAQs
What is the best indicator for forex bots?
There is no universal best indicator. The right choice depends on the strategy and market condition.
Do more indicators mean better signals?
Not always. Too many indicators can create confusion or overfitting.
Can indicators predict the future?
No. They analyse past and current price data; they do not guarantee future outcomes.
Educational content only. Trading involves risk, and past or historical performance does not guarantee future results.