AlgoBot Smart Structure Method (SSM) is a trend-state indicator that focuses on detecting structural shifts in price behavior. It simplifies decision-making by dynamically changing candle colors and plotting reversal dots whenever the short-term trend flips direction. The indicator also distinguishes between regular and strong signals, with optional higher timeframe synchronization for added context. Designed for traders who rely on market structure and clean visuals, AlgoBot SSM provides a versatile framework for identifying momentum shifts and aligning trades with dominant trends.
Key Features
Higher Timeframe Synchronization
Choose to base candle colors and/or signals on a higher timeframe instead of the chart’s local timeframe. This provides multi-timeframe confirmation, helping traders align entries with broader structural trends.
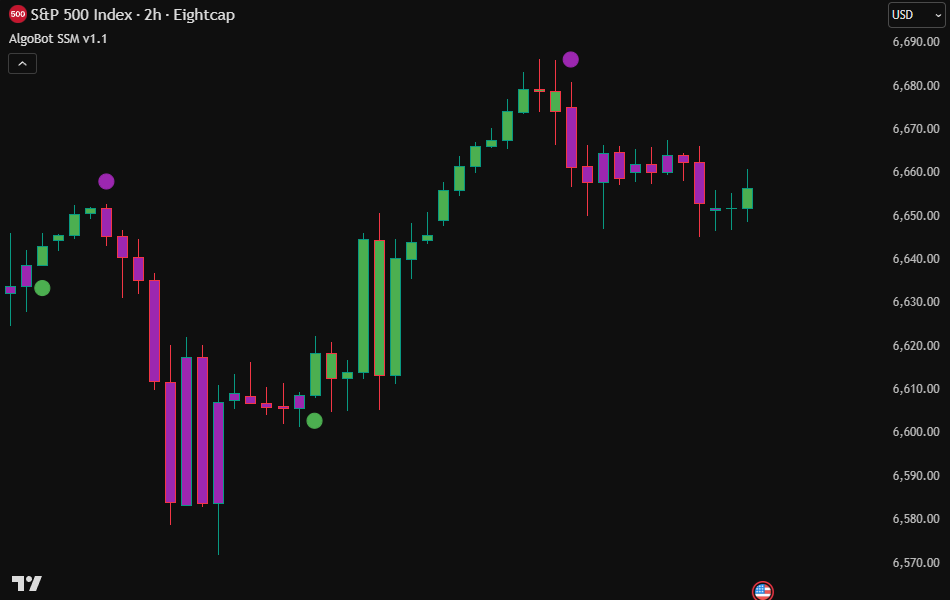
Dynamic Candle Coloring
Candle colors adapt in real time to reflect bullish or bearish conditions. Colors can follow either the local structure or higher timeframe, ensuring clarity and consistency across different chart setups.

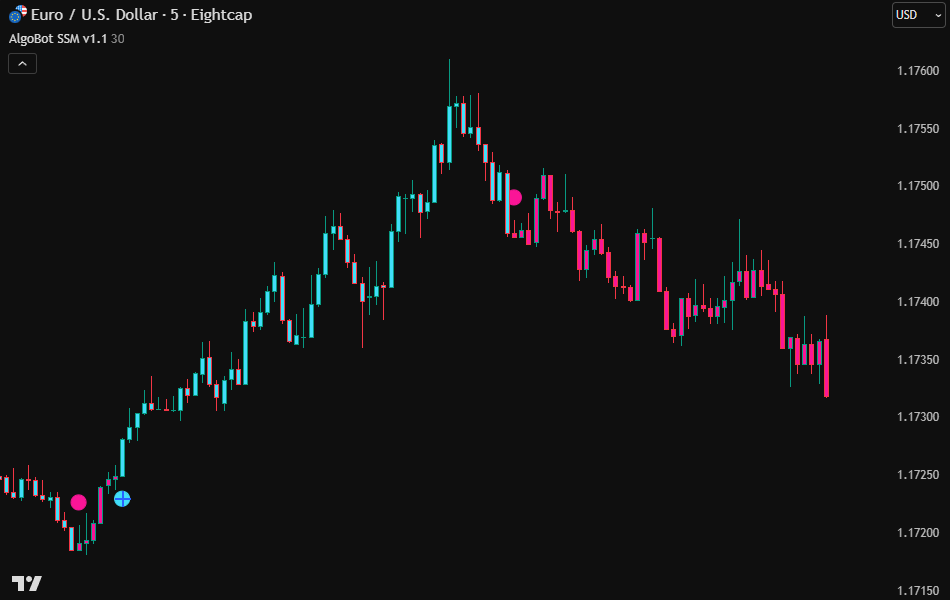
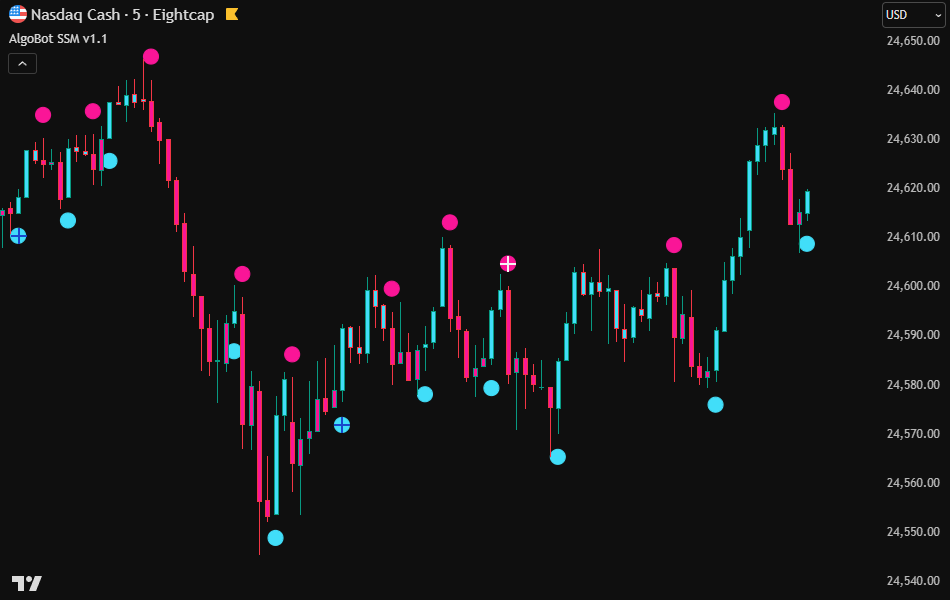
Signal Dots and Strong Markers
Dots are plotted on bars where the trend flips direction, while strong conditions are highlighted with cross markers. This visual separation helps distinguish ordinary shifts from higher-quality structural signals.
Strong Signal Filtering
Enable the “Show Only Strong Signals” option to hide regular dots and focus solely on confirmed strong conditions. This reduces noise and provides a cleaner charting environment for conservative trading approaches.

Bar-Close Confirmation
For increased reliability, enable the “Change Color Only After Candle Close” option. This ensures structural shifts are confirmed at bar close, reducing the chance of premature signals during intrabar price action.

Customizable Colors
Select preferred bullish and bearish colors to match your chart theme. Strong signals are accentuated with built-in contrasting accents for quick recognition.
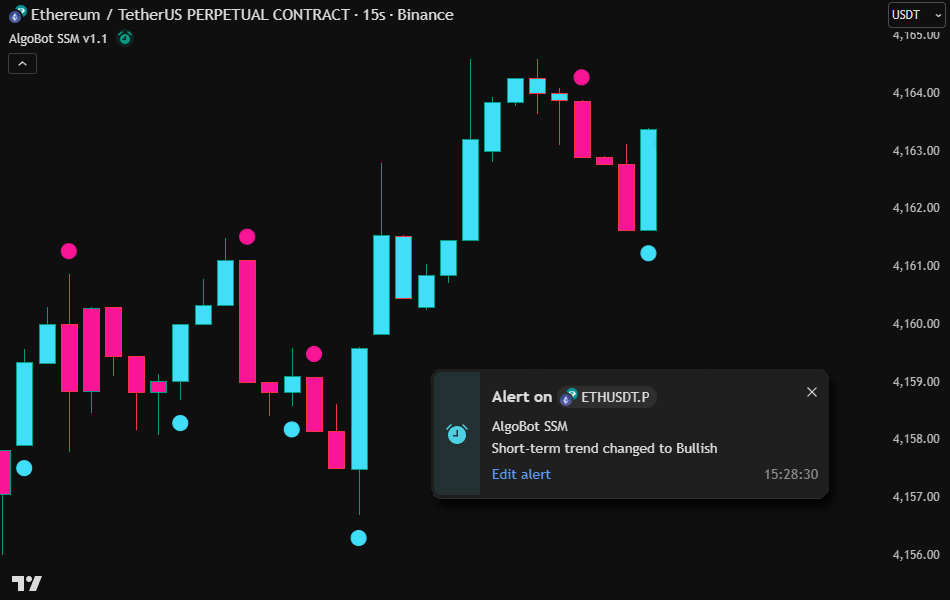
Integrated Alerts
Built-in alerts notify traders when a bullish or bearish flip occurs, as well as when strong signals appear. Alerts can be synced with the higher timeframe or local structure, depending on your strategy.
How to Use
AlgoBot SSM is designed to help traders understand market structure through a simplified visual framework, similar in concept to the Dow Theory. Dots represent potential pivot points that can be interpreted as Higher Highs (HH), Higher Lows (HL), Lower Lows (LL), or Lower Highs (LH). Strong dots with crosses act like “Change of Character” (CHoCH) signals, showing the first signs that the established trend may be challenged. These do not guarantee a reversal but indicate a shift or possible consolidation.
Basic trading idea:
- BUY: when a new blue dot forms higher than the previous blue dot → suggests HH/HL structure in an uptrend
- SELL: when a new pink dot forms lower than the previous pink dot → suggests LH/LL structure in a downtrend
Example workflow:
- Identify the most recent blue or pink dot.
- Wait for the next dot of the same color to form.
- Compare its position with the previous dot:
- If a blue dot is higher than the last blue dot → confirms HH/HL sequence → consider trend-following long entries.
- If a pink dot is lower than the last pink dot → confirms LH/LL sequence → consider trend-following short entries.
- Pay special attention to strong dots with crosses — they are early warnings of possible trend shifts (CHoCH). These may lead to reversals or consolidations and can be used as risk-management signals or opportunities for more aggressive entries.
This method can be kept very simple or expanded into advanced structure reading (multi-timeframe analysis, liquidity concepts, or swing mapping). The indicator is flexible — the strategy depends on the trader.
AlgoBot Smart Structure Method Key Features Summary
- Synchronizes candles and signals with higher timeframe context
- Colors candles dynamically to reflect bullish or bearish structure
- Plots dots for flips and crosses for strong signals
- Filters to show only strong conditions when enabled
- Confirms direction shifts only after bar close if selected.
- Allows full customization of bullish and bearish colors
- Provides alerts for flips and strong signals