TradingView is renowned for its powerful charting capabilities and real-time data. It also offers an arsenal of indicators that can help simplify market analysis and refine trading strategies.
This guide explores why TradingView indicators have become indispensable in today’s trading landscape. We also discuss the best indicators available on TradingView and offer tips for optimizing them.
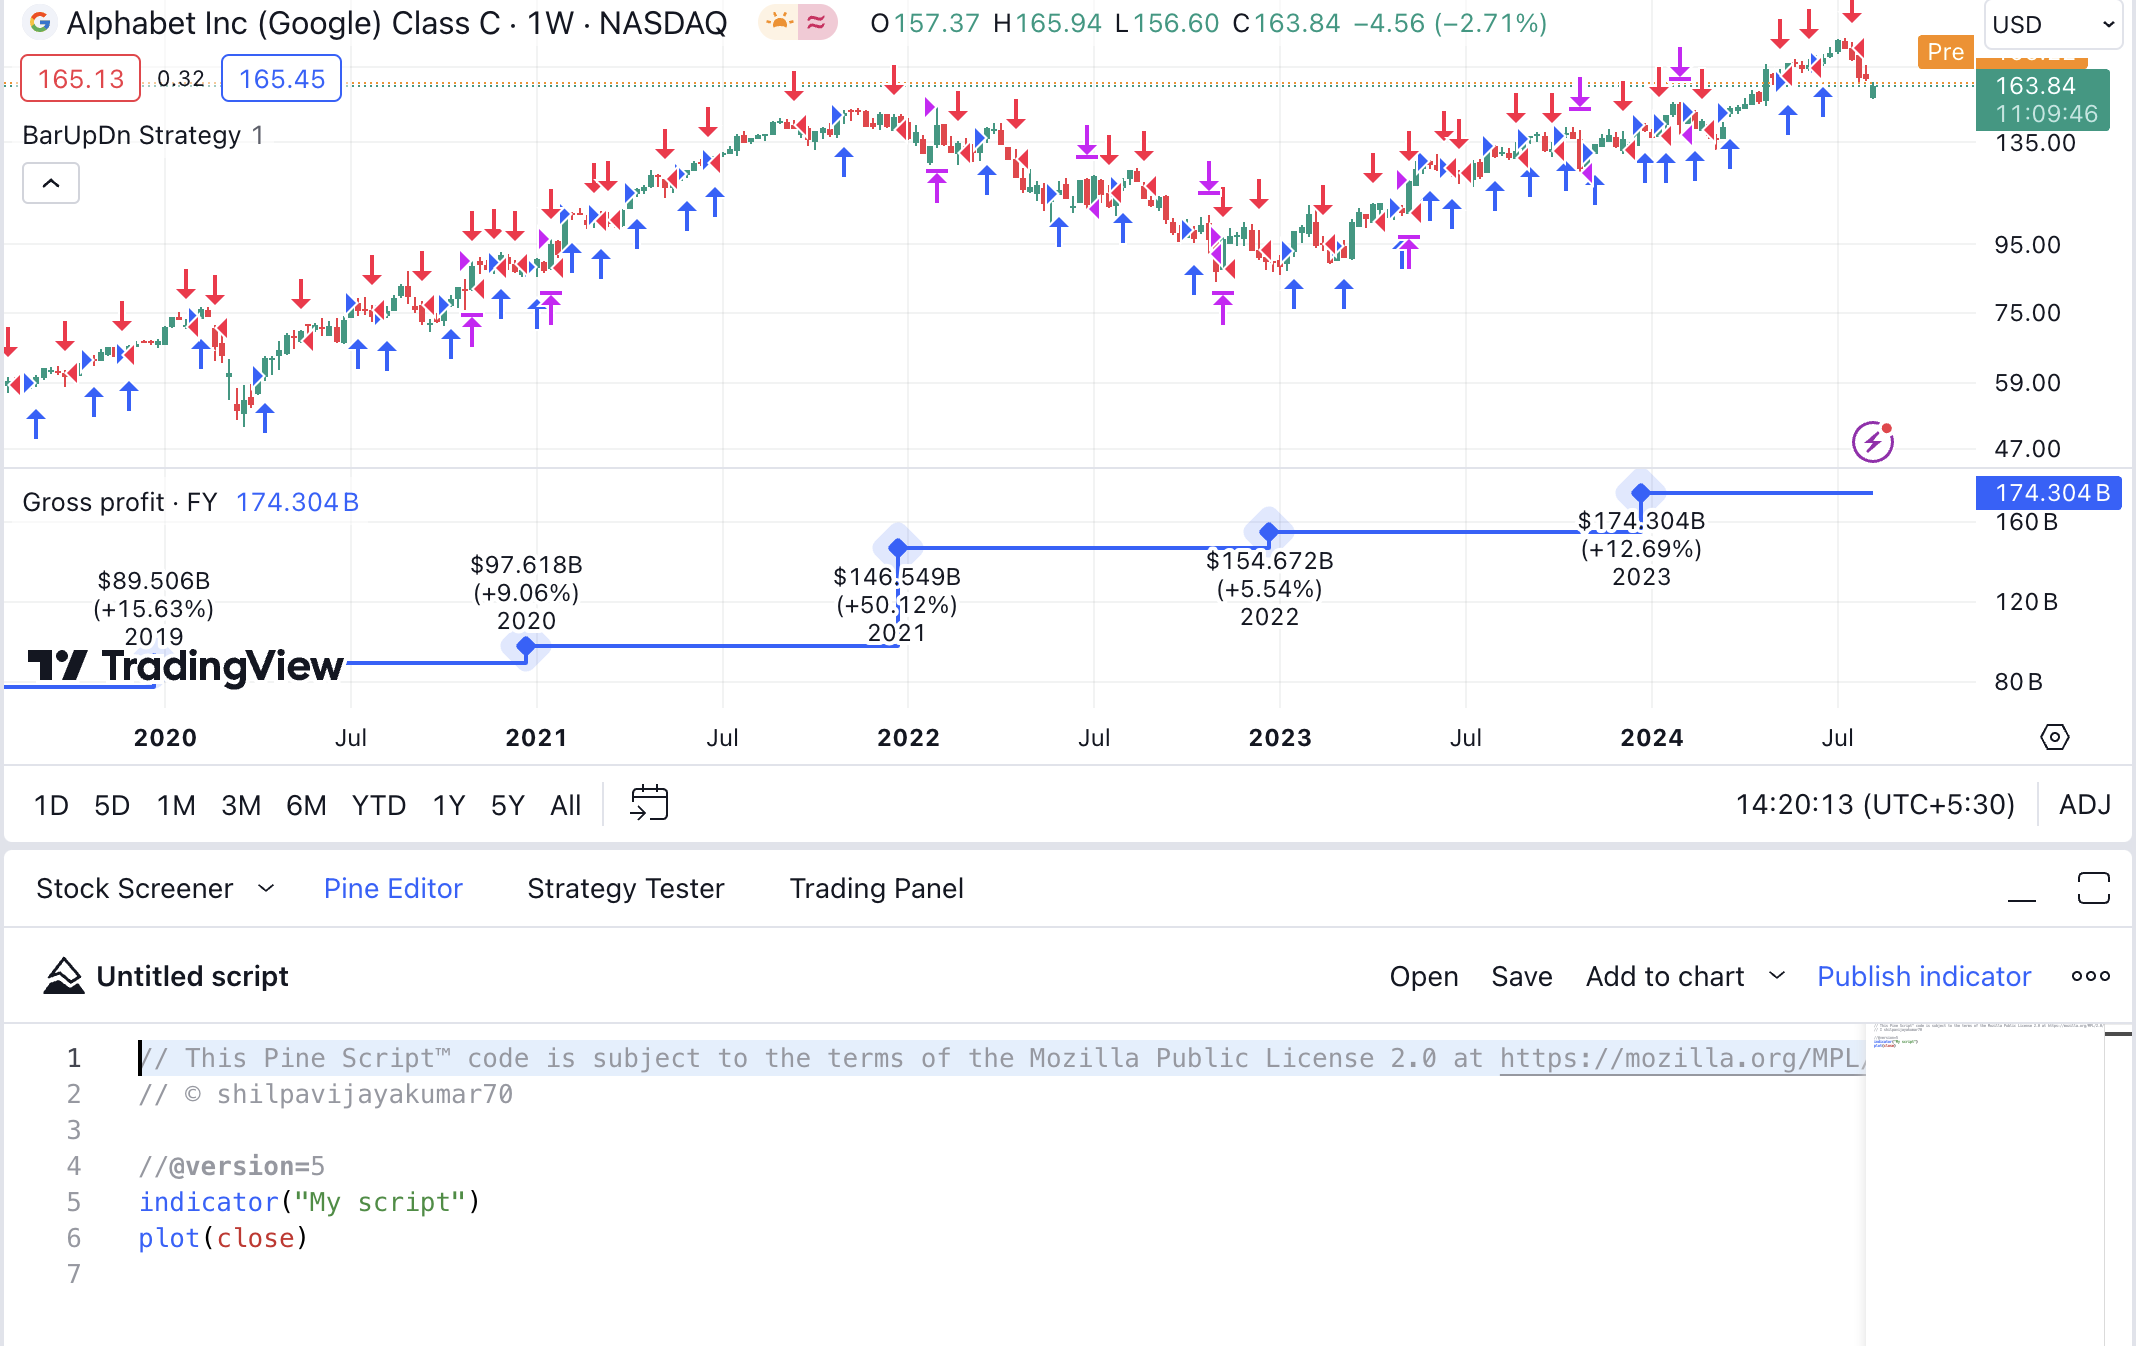
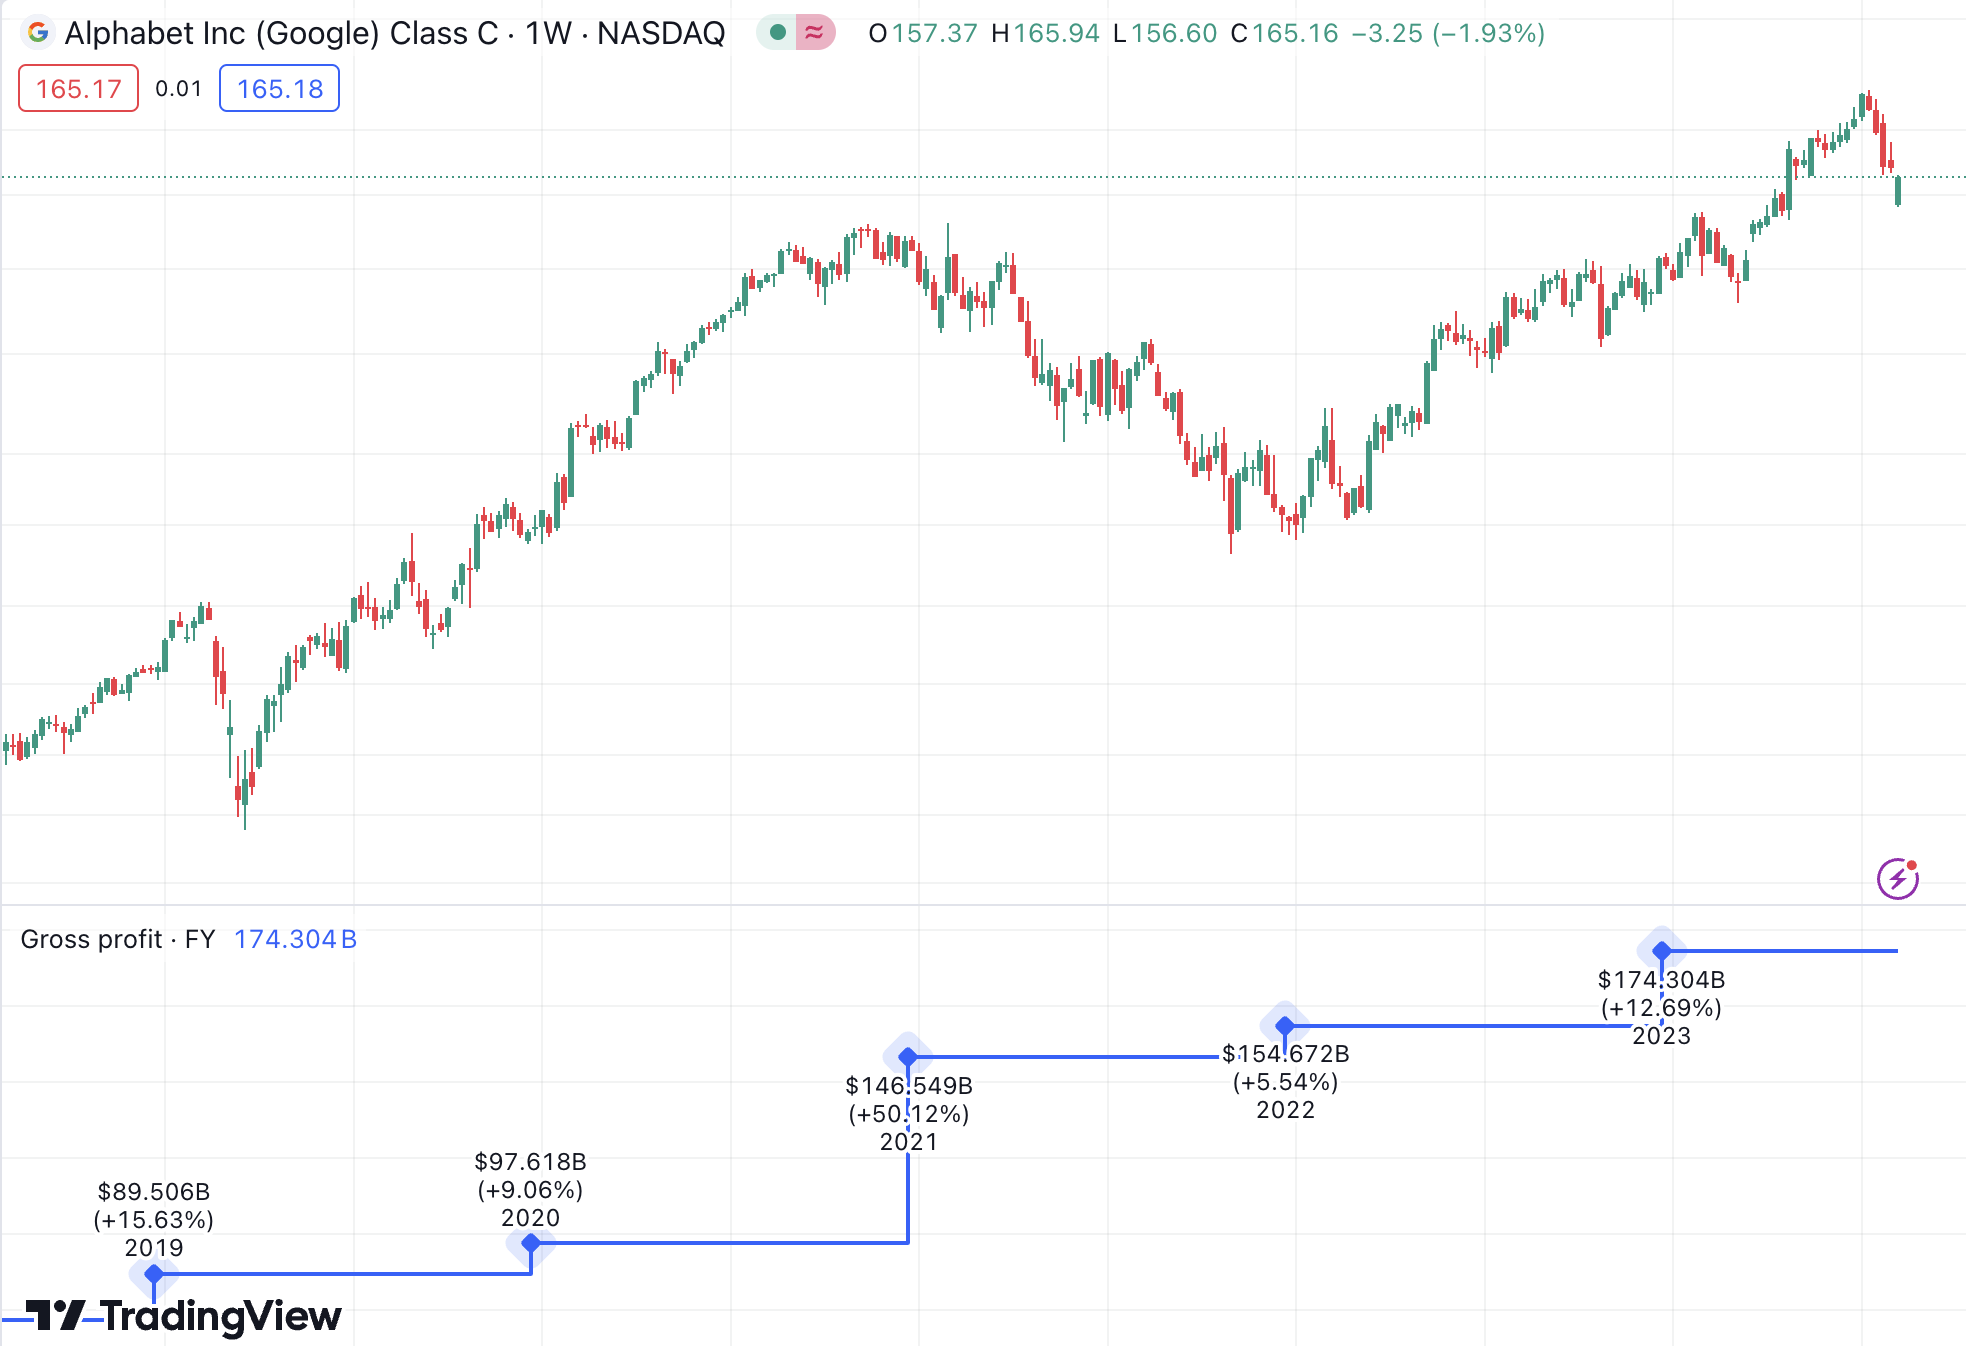
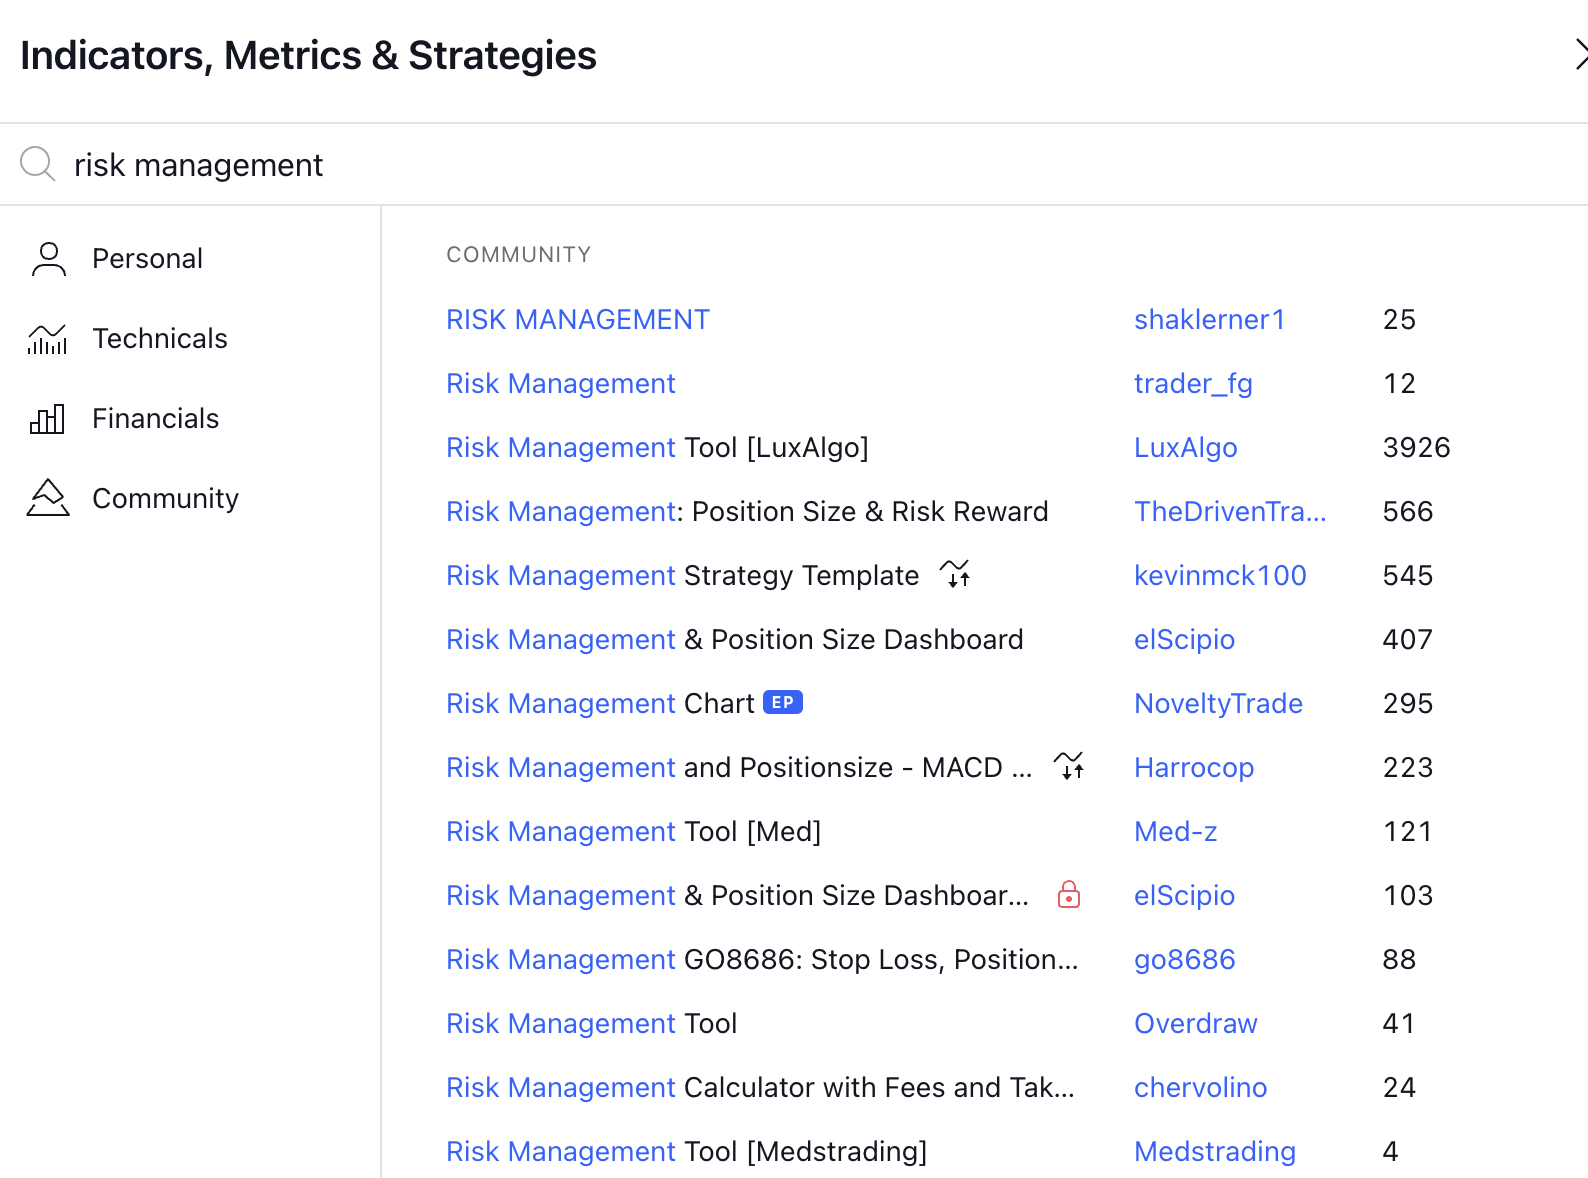
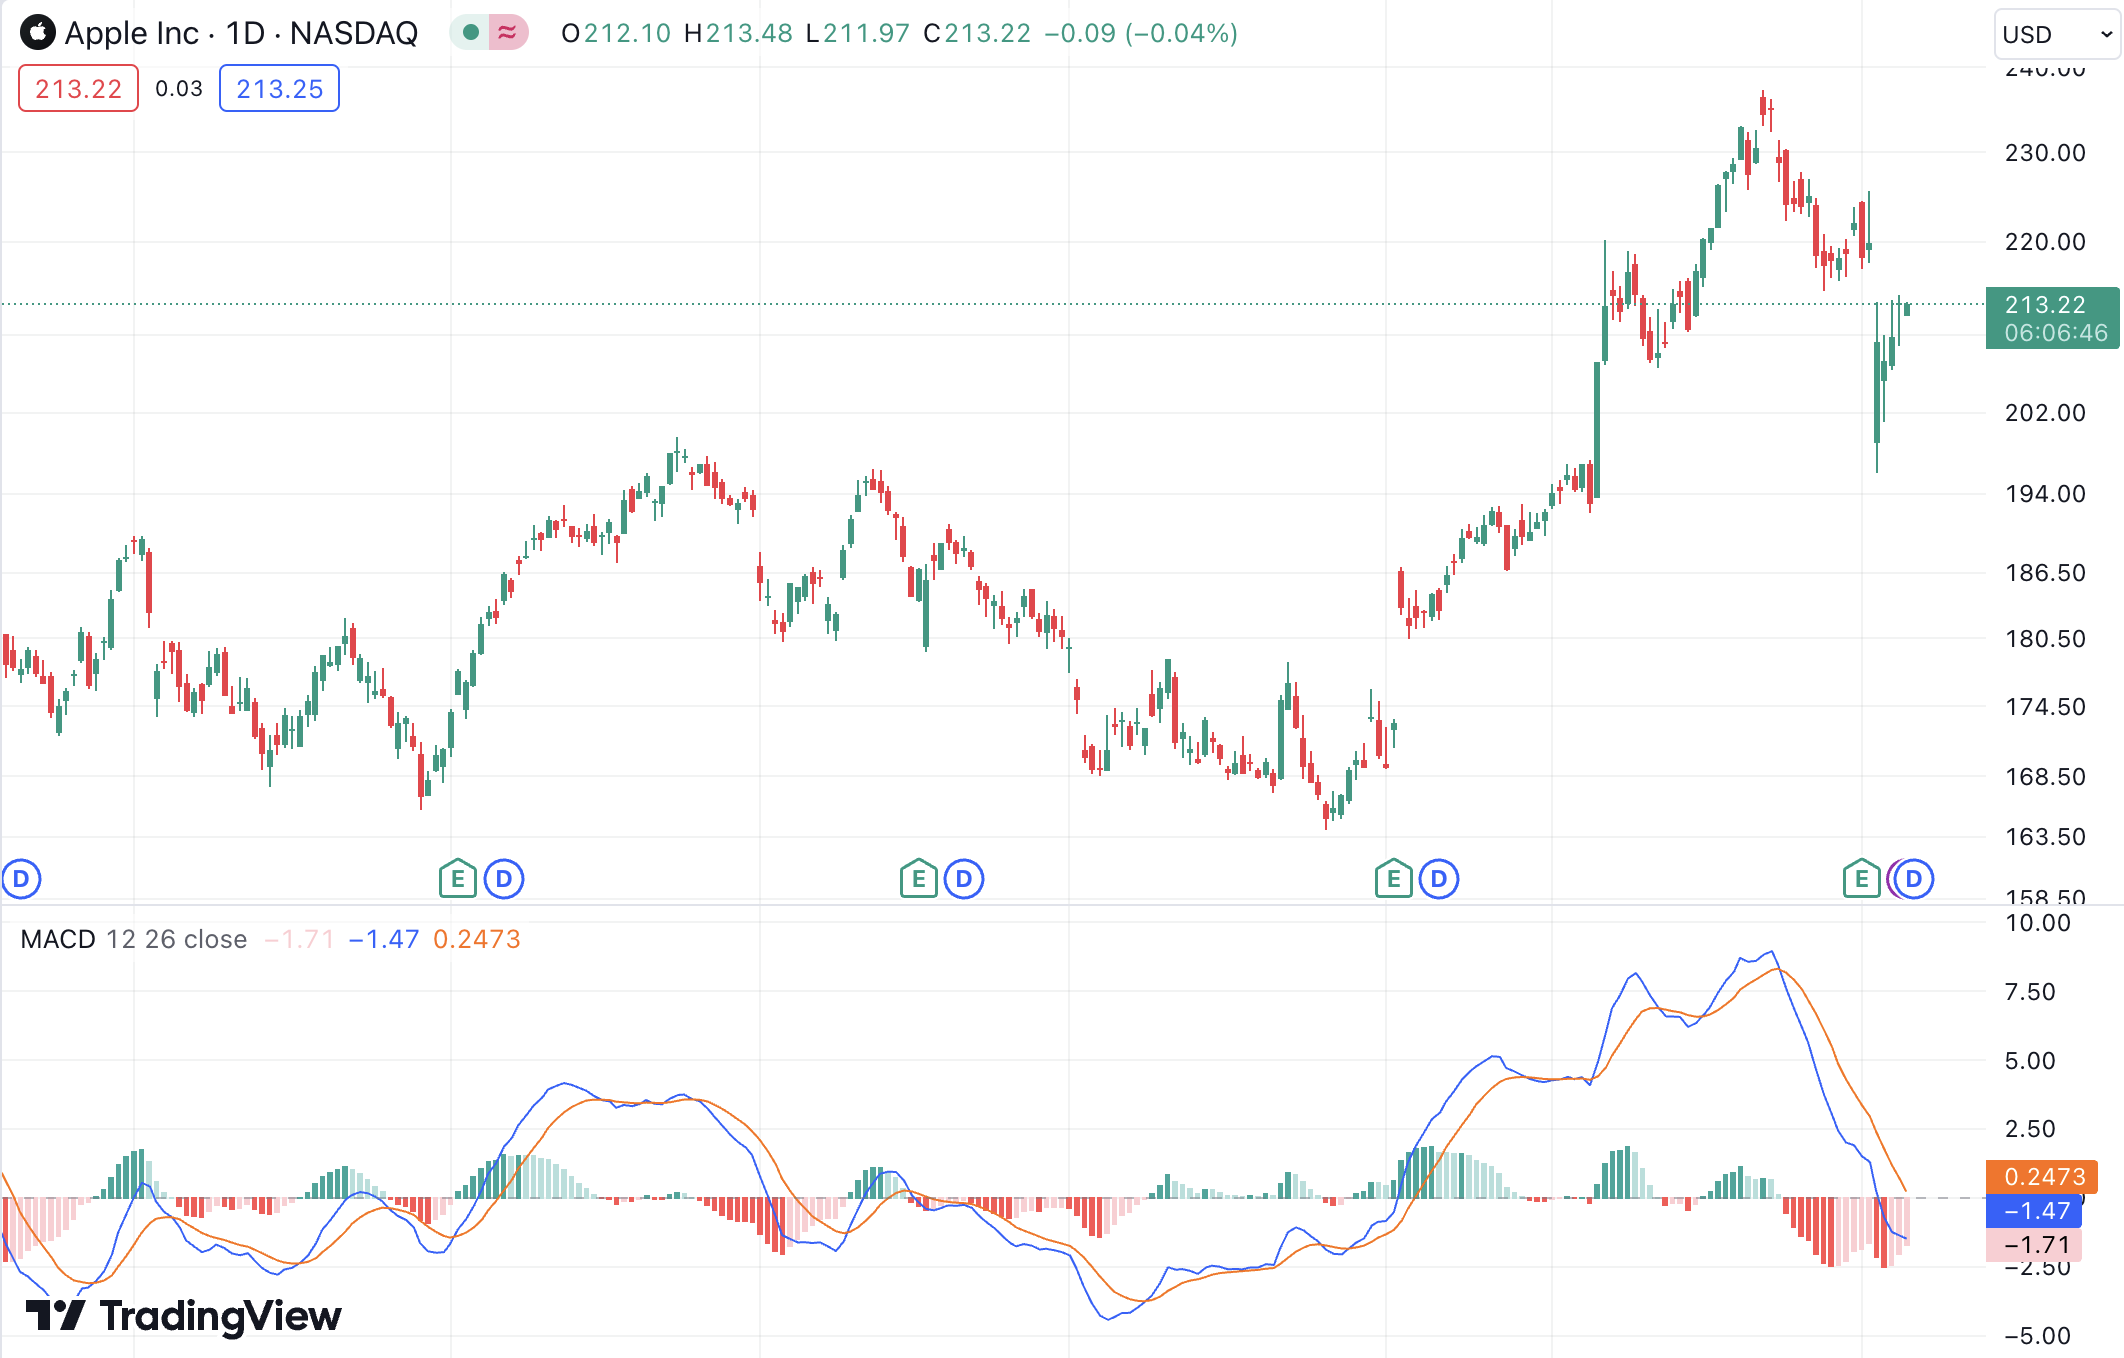
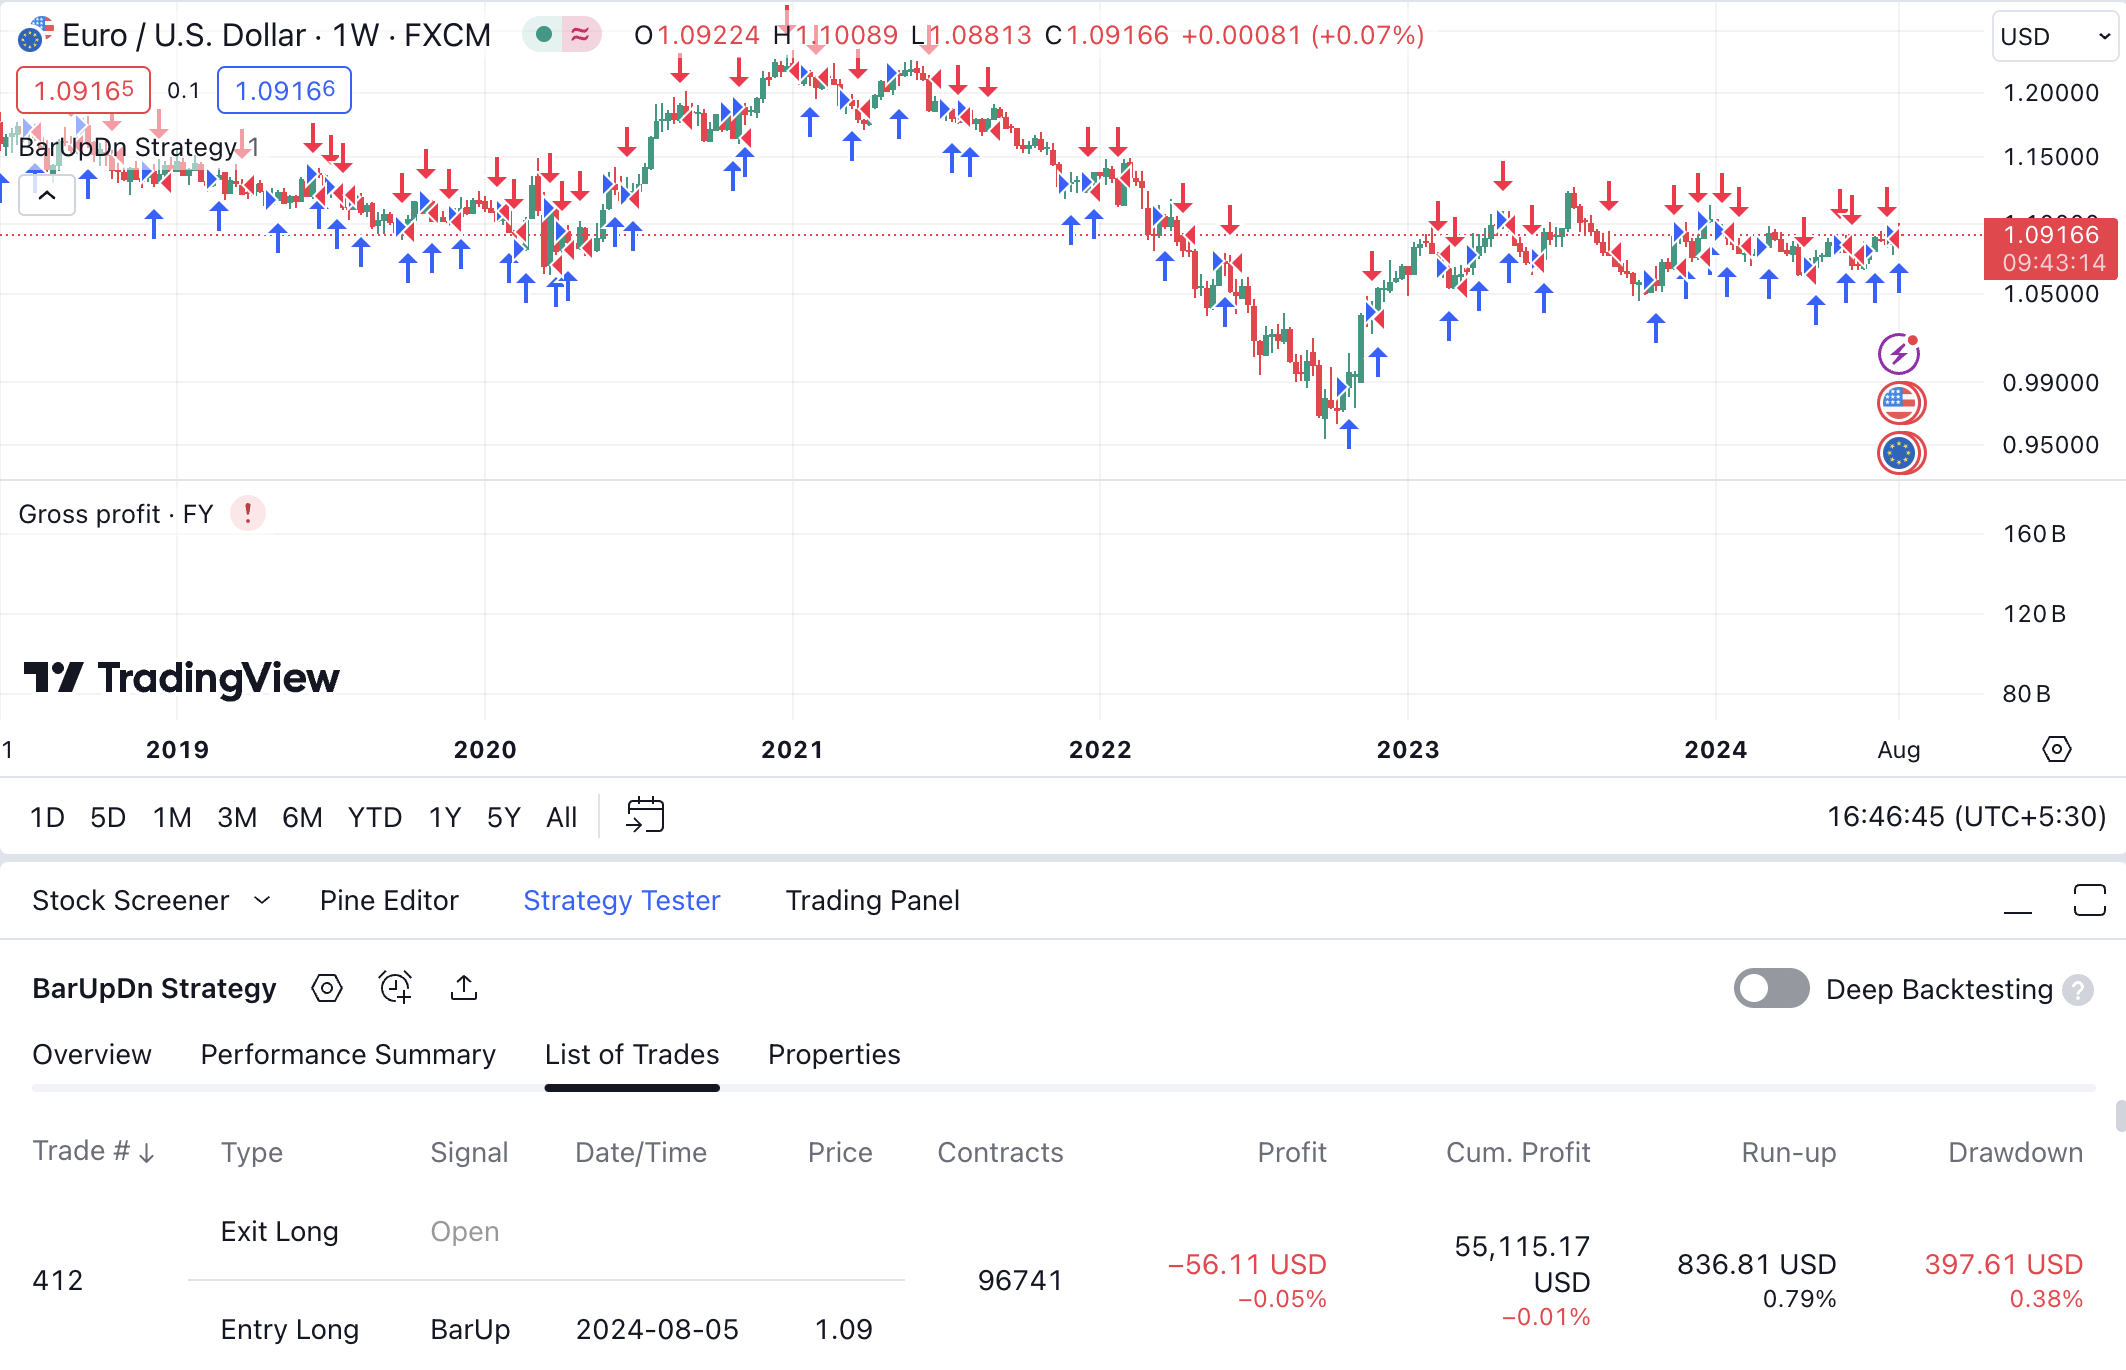
Looking for a snapshot of TradingView indicators? Here are the most essential points to know: TradingView is an analysis platform for traders. It offers real-time data on a wide range of asset classes, including stocks, forex, commodities, indices, and cryptocurrencies. Moreover, the platform has an extensive library of technical analysis tools. Crucially, TradingView boasts a user-friendly interface. Whether you’re a beginner or professional, TradingView has tools specific to your expertise. For those unaware, indicators are tools used to dissect an asset’s price movement. With these tools, traders can evaluate if a trend will be sustained. Or if a reversal is more likely. Indicators also help traders decide when to enter and exit trades. On TradingView, these indicators are seamlessly integrated into the charting interface. This lets you access indicators with just a few clicks. Once applied, these indicators are visually represented on charts. Put otherwise, TradingView makes complex data easier to interpret and apply to trading strategies. There are virtually hundreds of TradingView indicators available for each asset class. The challenging part is knowing how to interpret the indicator’s findings and make trading decisions accordingly. TradingView comes loaded with built-in indicators. Additionally, you can also access indicators developed by other users. The specifics of how a TradingView indicator works vary from one tool to another. However, you can sum up the process as follows: Traders can analyze these plotted lines or values to make trading decisions. For example, if the asset’s price is on top of the Moving Average line, it points to an uptrend. Conversely, if the price is below the line, it points to a downtrend. TradingView indicators can also be used with other tools and analysis techniques. This helps to refine strategies further and improve decision-making. On TradingView, the types of indicators available will depend on the specific asset. Moreover, you might need a premium subscription to access some of the built-in indicators. TradingView indicators can be broadly classified into four sections. The financial indicators available on TradingView are used for stock fundamental analysis. They help investors assess companies’ financial health and performance. Financial TradingView indicators typically cover the following metrics: TradingView obtains this financial data from annual and interim company reports. Additionally, the financial data is standardized on par with international codes. This is because companies release reports at different times and have unique accounting procedures. Standardization helps ensure consistency and comparability of financial data across different companies. TradingView boasts hundreds of indicators tailored for technical analysis. The different types of technical TradingView indicators are summarized below: Note that on TradingView, the indicators aren’t categorized by type. You can either browse through the entire selection or search for specific indicators. TradingView indicators also include a variety of chart patterns. These indicators look for recurring price trends on the chart. They help traders determine price target levels and forecast price action. TradingView offers three types of chart patterns – continuation, reversal, and undefined. Some examples include bullish and bearish flags, triangle charts, triple bottom, and rising and falling wedge patterns. Additionally, you can also find patterns based on theories such as the Elliott Wave. Tech-savvy traders can also create their own TradingView indicators. This is done using Pine Script, a programming language developed by TradingView. The code editor is located in the lower panel of the chart. Users can write, save, and publish their indicators through this editor. For beginners, TradingView provides detailed guides on learning Pine Script. Additionally, users can also backtest and forward-test these strategies. The paper trades are simulated directly on your charts. As the chart data updates, so does the strategy report, reflecting forward testing. This allows traders to test their strategies and fine-tune trading decisions. TradingView also has a long list of strategies developed by its other users. You can explore and modify these existing scripts from TradingView’s ‘Community’ panel. For those new to TradingView, here are the required steps to access indicators: The indicator will automatically be applied to your chart, and you’ll see its graphical elements displayed. One of the best aspects of TradingView indicators is that they can be customized. Each indicator has a gear icon next to its name on the chart. Once you click it, you can adjust the different parameters, such as the period length, calculation methods, and visual styles. These customization options allow you to fine-tune the indicators so they align more closely with your trading goals and existing market conditions. TradingView indicators come with several benefits – which are discussed below. One of TradingView’s biggest benefits is the ease of access. It provides all the tools needed for a comprehensive analysis in one place. Moreover, the platform is compatible with almost all asset classes. This includes stocks, ETFs, indices, cryptocurrencies, forex, and bonds. You can also track derivatives such as options and futures. Additionally, TradingView features countless indicators and prebuilt strategies. You can also create your own Tradingview indicators. When used together, these tools help traders understand market dynamics from multiple perspectives. Another key advantage of TradingView is its ability to overlay various indicators directly onto charts. This simplifies data visualization for traders. TradingView extends this capability to fundamental indicators as well – which is not commonly found on other platforms. For example, metrics such as total revenue, gross profit, and cash flow can be integrated into stock charts. Usually, stock traders must read through reports to understand the company’s financials. With graphical visualization, TradingView makes the process considerably easier. Moreover, overlays help traders correlate with market price movements. Needless to say, this enhances accessibility and interoperability for traders. TradingView allows extensive customization for its indicators. Traders can adjust settings and visual styles to tailor indicators to their specific trading goals. Customizing indicators helps in optimizing them for particular assets, time frames, and market conditions – improving their relevance and accuracy. TradingView lets users set alerts based on indicator conditions. This functionality helps traders stay informed of noteworthy market changes and trading signals. Moreover, this removes the need to constantly watch over pricing charts. Instead, you can make trading decisions and orders when you receive notifications. Alerts can be customized for specific indicator values or patterns, enhancing proactive trading. TradingView isn’t just limited to built-in indicators. It also lists a vast library of indicators developed by other users. In fact, you can use test third-party indicators in a demo account or use them for copy trading strategies. Moreover, TradingView’s scripting language is very transparent. You can view and modify the code behind each indicator, allowing you to experiment and learn from other traders. Not only that, you can also interact with other TradingView users – the platform comes with a built-in chat tool. No matter your trading style, risk management must play a vital role in your strategy. TradingView indicators can be of significant help here. For instance, you can use trend indicators to decide on the direction of trades. Similarly, volatility-based indicators can assist in finding appropriate exit price points for your positions. By using multiple indicators, traders can better handle their risk exposure. This ensures that losses are minimized. This disciplined approach to managing risk is paramount for success. You can also find user-created risk management tools on TradingView. Some send signals regarding the entry and exit prices, as per your risk level. If you’re new to trading, TradingView also has a wealth of educational resources for you. These are designed to help beginners understand indicators effectively. This makes TradingView indicators accessible to novice traders. The resources include documentation and tutorials. Moreover, there is a supportive community where users can look for advice. This section explores the best TradingView indicators. Read on to choose the most suitable indicators for your trading strategy and preferred asset class. Moving Average is a popular TradingView indicator used to identify trends. It’s relatively easy to use, so is considered a beginner-friendly indicator. Moreover, the Moving Average can be used for all asset classes. In essence, this indicator calculates the average price of an asset over a given period. Traders use this tool to see the general direction of the market. For instance: On TradingView, you can choose from different versions of Moving Average, such as Simple, Ribbon, Exponential, Weighted, and more. Each serves a different purpose and can be selected based on your trading strategy and the asset you’re analyzing. The Moving Average Convergence Divergence is another technical indicator used to spot buy and sell signals. It’s an oscillator with two lines – the MACD and the signal. Traders consider an asset to be in a bullish trend when the MACD line surpasses the signal level and vice versa. Additionally, the indicator also has an MACD histogram. This is a graphical representation showing the difference between the MACD line and the signal line. Among volatility indicators, Bollinger Bands is perhaps the most newbie-friendly option. It’s often used in combination with indicators like Moving Average and Relative Strength Index. This indicator has three lines – a Moving Average in the middle and two outer bands representing the deviation of the price movement. When the asset’s price moves within the outer bands, then the market is considered to be in the normal volatility range. Conversely, when the asset’s price moves past the outer bands, the asset is considered to be overbought or oversold. When this happens, a potential trend reversal might occur. This TradingView indicator gauges how fast an asset’s price changes. In other words, it offers insight into the momentum. It ranges between 0 and 100. Usually, values above 70 points to overbought conditions. And levels below 30 are considered oversold. Traders use the Relative Strength Index to interpret potential reversal points. Additionally, if this indicator conflicts with the underlying trend, it could reveal the continuation of the pattern. Support and resistance levels are used to determine trend direction and reversals. The Fibonacci Retracement indicator helps traders find these levels. These are horizontal lines plotted on the price chart using Fibonacci ratios. The line is drawn by connecting the high and low points of a trend. The indicator then generates potential price points that could work as support and resistance levels. They can also be used to determine entry and exit positions. This indicator offers insights into market volatility. It calculates the average price variations over a given period. Typically, the default time duration used for the Average True Range is 14 days. However, TradingView lets you adjust this period based on your strategy. When the indicator is high, it implies that the market’s volatility is increasing. Conversely, a low Average True Range suggests less volatility. Notably, the Average True Range is not commonly used as a standalone indicator. Rather, it’s combined with other indicators to confirm its findings. The Parabolic SAR can help traders find potential reversal points in a market trend. The indicator signals where a trend might change direction by plotting dots either above or below the price chart. These dots are positioned based on the price action and trend direction. When the price is above the SAR dots, it indicates an uptrend. Therefore, traders may consider holding long positions or entering new ones. Conversely, when the price falls below the SAR dots, it signals a downtrend. This suggests that traders might look for sell signals or consider closing long positions. The Parabolic SAR is particularly useful for risk management by identifying stop-loss limits. As the name suggests, this indicator tracks an asset’s trading volume. It measures volume relative to its price movements. The On-Balance Volume is calculated daily. Moreover, it’s commonly used for stocks, forex, and commodities. This is because these assets often fluctuate based on trading volume. Furthermore, the On-Balance Volume is also used to confirm trends. An increasing On-Balance Volume line suggests that the existing trend is likely to continue. On the contrary, a declining On-Balance Volume line may indicate that the trend is weakening. With a long array of TradingView indicators at your disposal, it’s confusing to know which ones to use. Moreover, there is no single indicator that works the same for everyone. Here’s what to consider when choosing the best TradingView indicator for your requirements: The first step is to define your trading goals and style. This will significantly influence which indicators are most useful for you. For instance: In other words, the first step is to have a clear plan for approaching the market. The type of asset you’re trading also plays a crucial role in selecting appropriate indicators. Different assets have unique characteristics that may require specific indicators for optimal analysis. For example, In a nutshell, you must consider the asset’s specific dynamics to find the most relevant TradingView indicators. Once you’ve identified potential TradingView indicators, it’s essential to test and validate them. You can do this by deploying indicators and testing them on a demo trading account. TradingView also offers tools for backtesting and forward-testing indicators. As mentioned, these tests will be displayed directly under the charts. This process helps determine their reliability and effectiveness in identifying profitable trade opportunities. TradingView indicators are also customizable, enabling you to adjust them to your unique needs. The majority of indicators have adjustable parameters, such as time frame or visualization style. To give an example, the Relative Strength Index uses a 14-period time frame. However, day traders can shorten this period to 8 or 10 to capture shorter-term momentum changes. Similarly, long-term investors can extend the time period to 30 or longer for a smoother trend analysis. No single indicator is perfect, and each comes with its own set of limitations. By combining two or more indicators, you’ll get more accurate signals. This way, you can change your trading approach to the evolving market parameters. As with all analysis tools, TradingView indicators come with limitations. Let’s take a closer look at the key drawbacks: The majority of TradingView indicators rely on historical data to generate signals. This means they tend to lag behind current market conditions. Even a delay of a few seconds can affect short-term trading outcomes in volatile markets. For instance, the Moving Average is based on past price movements and might not reflect sudden market shifts. This lag can result in delayed responses to new trends or price reversals, potentially causing traders to enter or exit positions too late. Another drawback is that indicators can produce false signals, leading to incorrect trading decisions. For example: While TradingView indicators can be useful, they also take time to master. You must put in the time and effort to learn different strategies, deploy charting tools, and understand indicators. In other words, it can be challenging and time-consuming to succeed. With this in mind, one of the best solutions is to use automated trading bots. For example, Algobot is an AI-backed algorithmic bot that integrates TradingView indicators: Put simply, Algobot works around the clock without any manual intervention. Moreover, the bot has an 81% win rate. All things considered, Algobot is a great choice for those looking to passively trade financial markets without learning how to use TraingView indicators.
TradingView provides an extensive suite of analysis tools that deliver critical insights to traders. From a single interface, traders can access hundreds of fundamental and technical indicators. Moreover, indicators are available for a wide variety of asset classes. To maximize the benefits of these indicators, traders must invest time in understanding their functionalities and limitations. Crucially, it’s best to use these indicators with other analytical methods to get a comprehensive view of the market. TradingView indicators provide visual tools for analyzing market movements and price action. They simplify complex data into actionable insights, aiding traders in developing strategies. Some of the most popular TradingView indicators include Moving Average, Relative Strength Index, Bollinger Bands, and Fibonacci Retracement. Traders can pick the best indicator for their specific trading goals. TradingView users can go to the ‘Indicator’ menu above the chart to find their preferred tool. The indicator will automatically be displayed on the chart. Yes, TradingView allows users to customize indicators by adjusting parameters or creating custom scripts via Pine Script. This flexibility allows traders to tailor indicators to their specific strategies.TradingView Indicators – Key Takeaways
What are TradingView Indicators?
How TradingView Indicators Work?
Types of TradingView Indicators
Financial Indicators
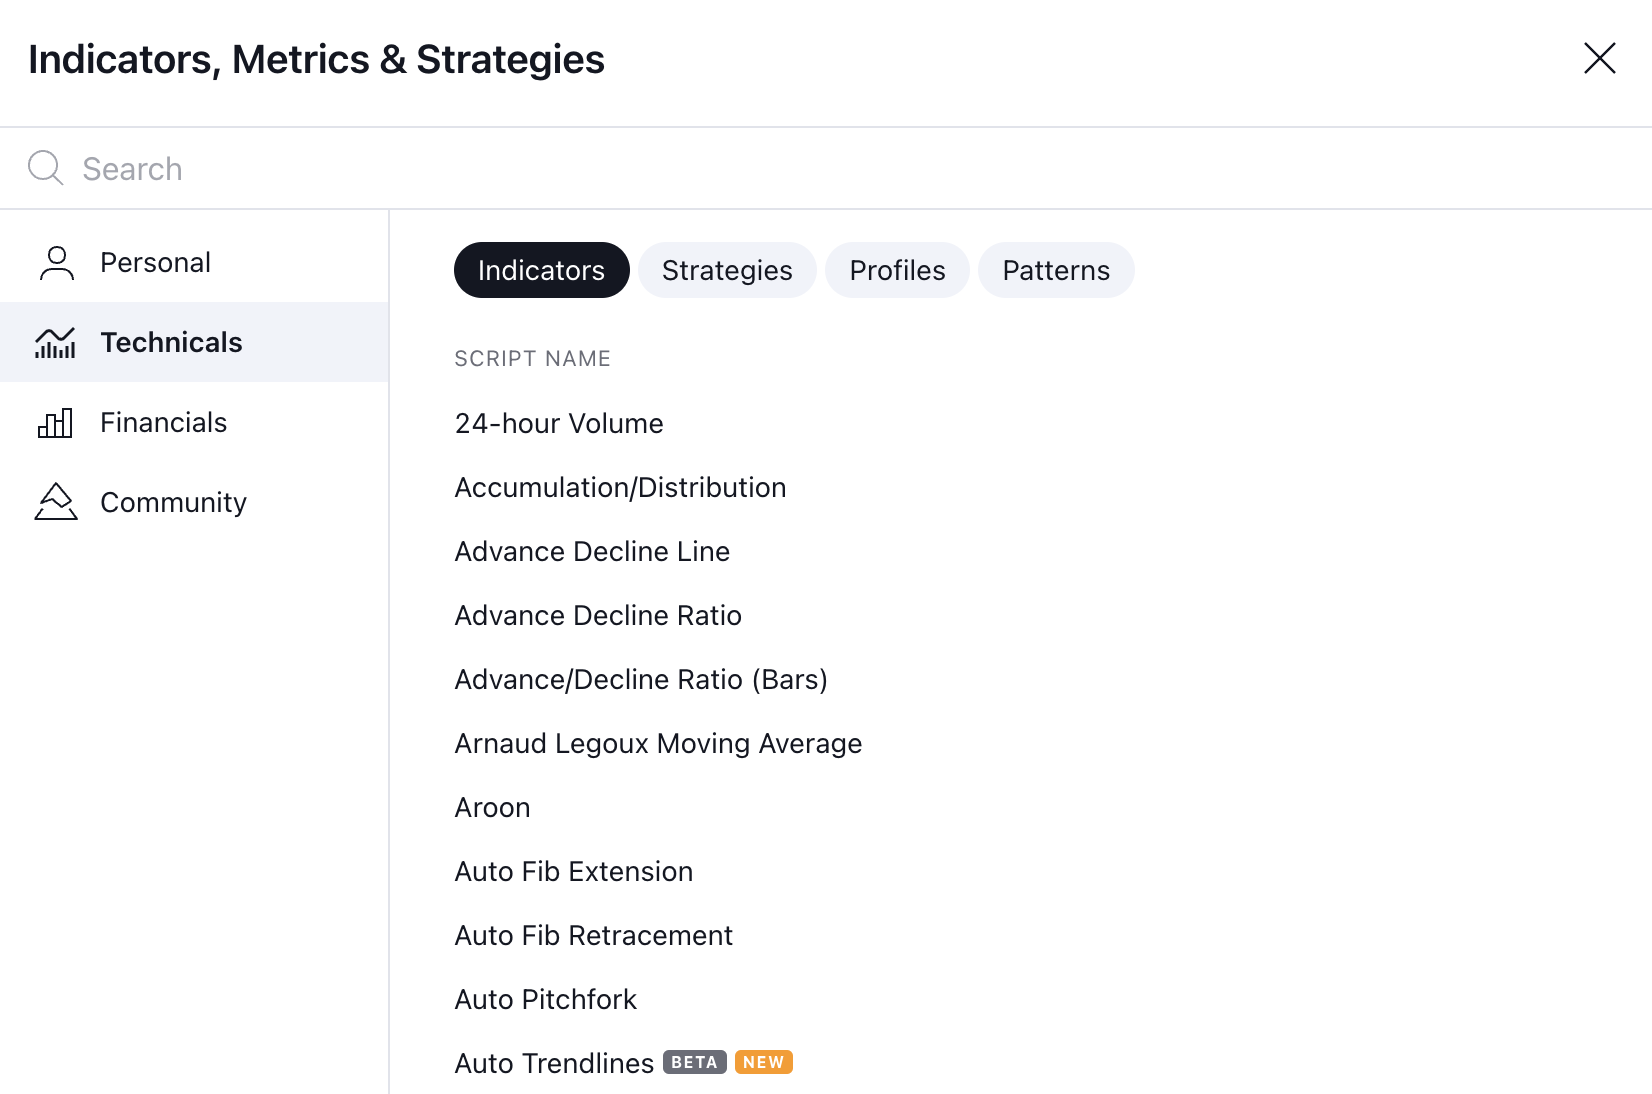
Technical Indicators
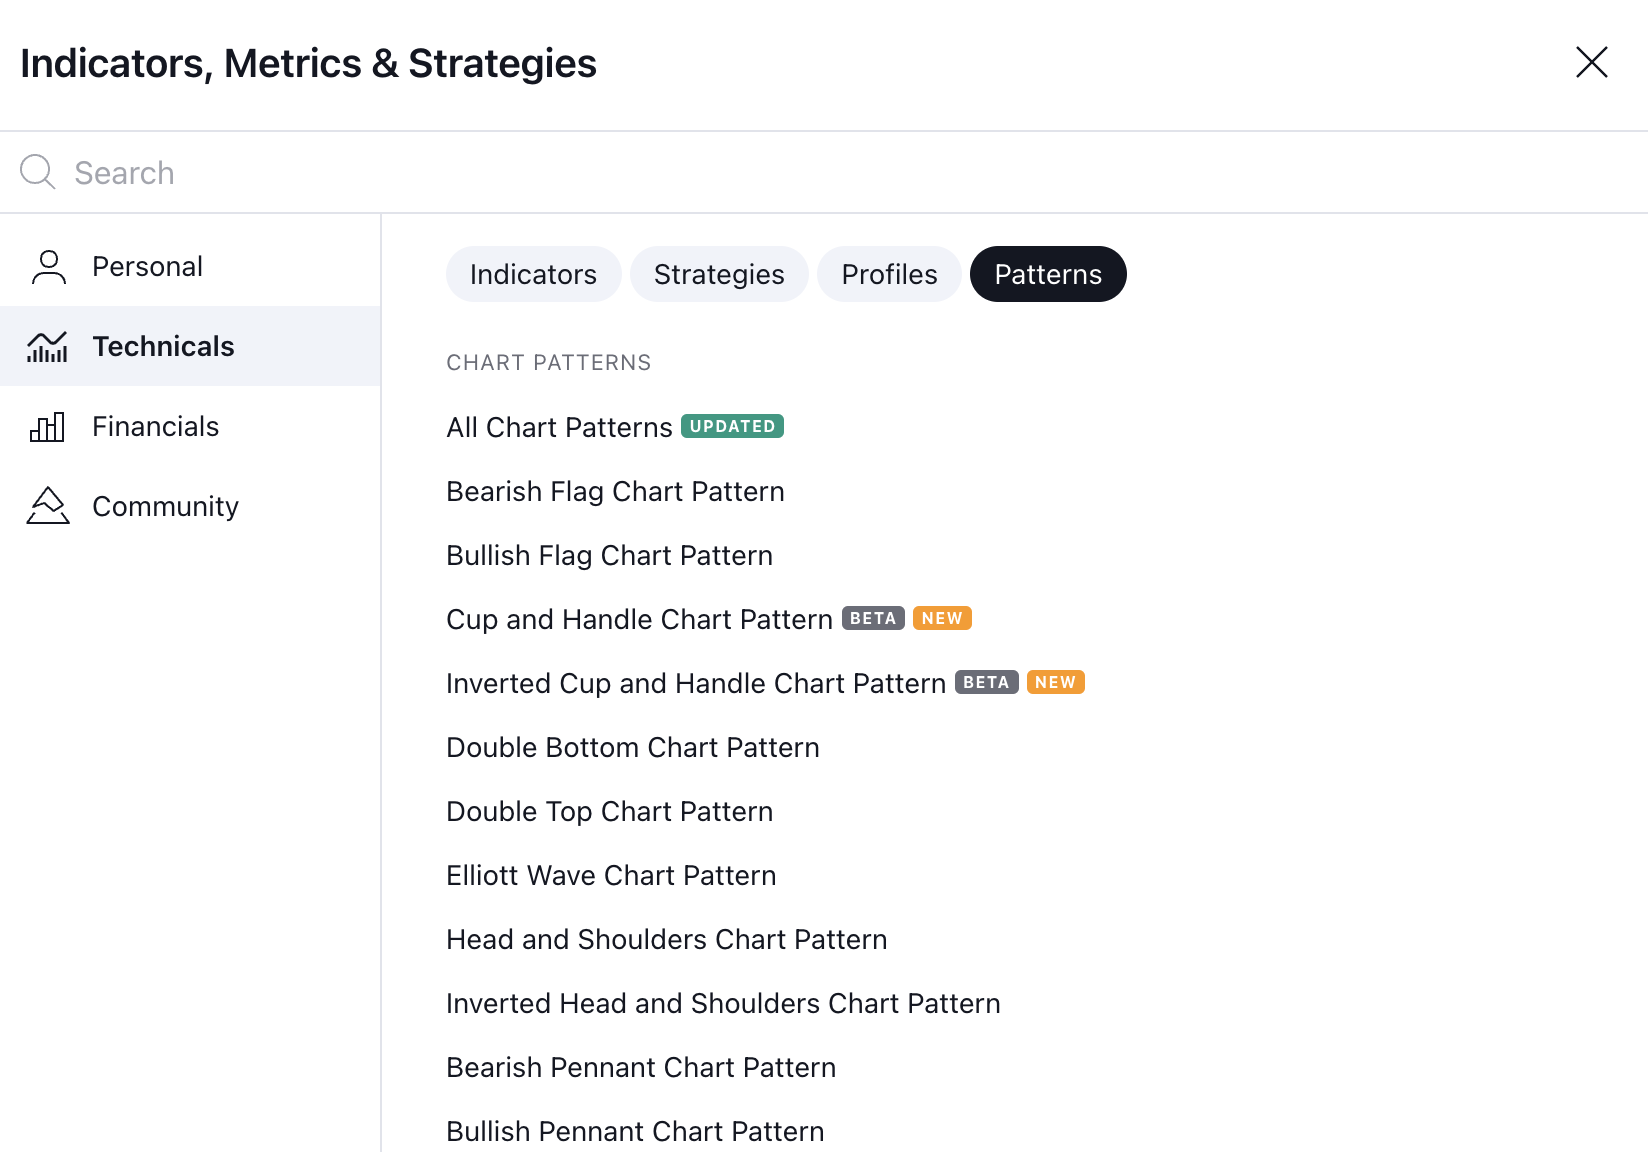
Chart Patterns
Pine Script
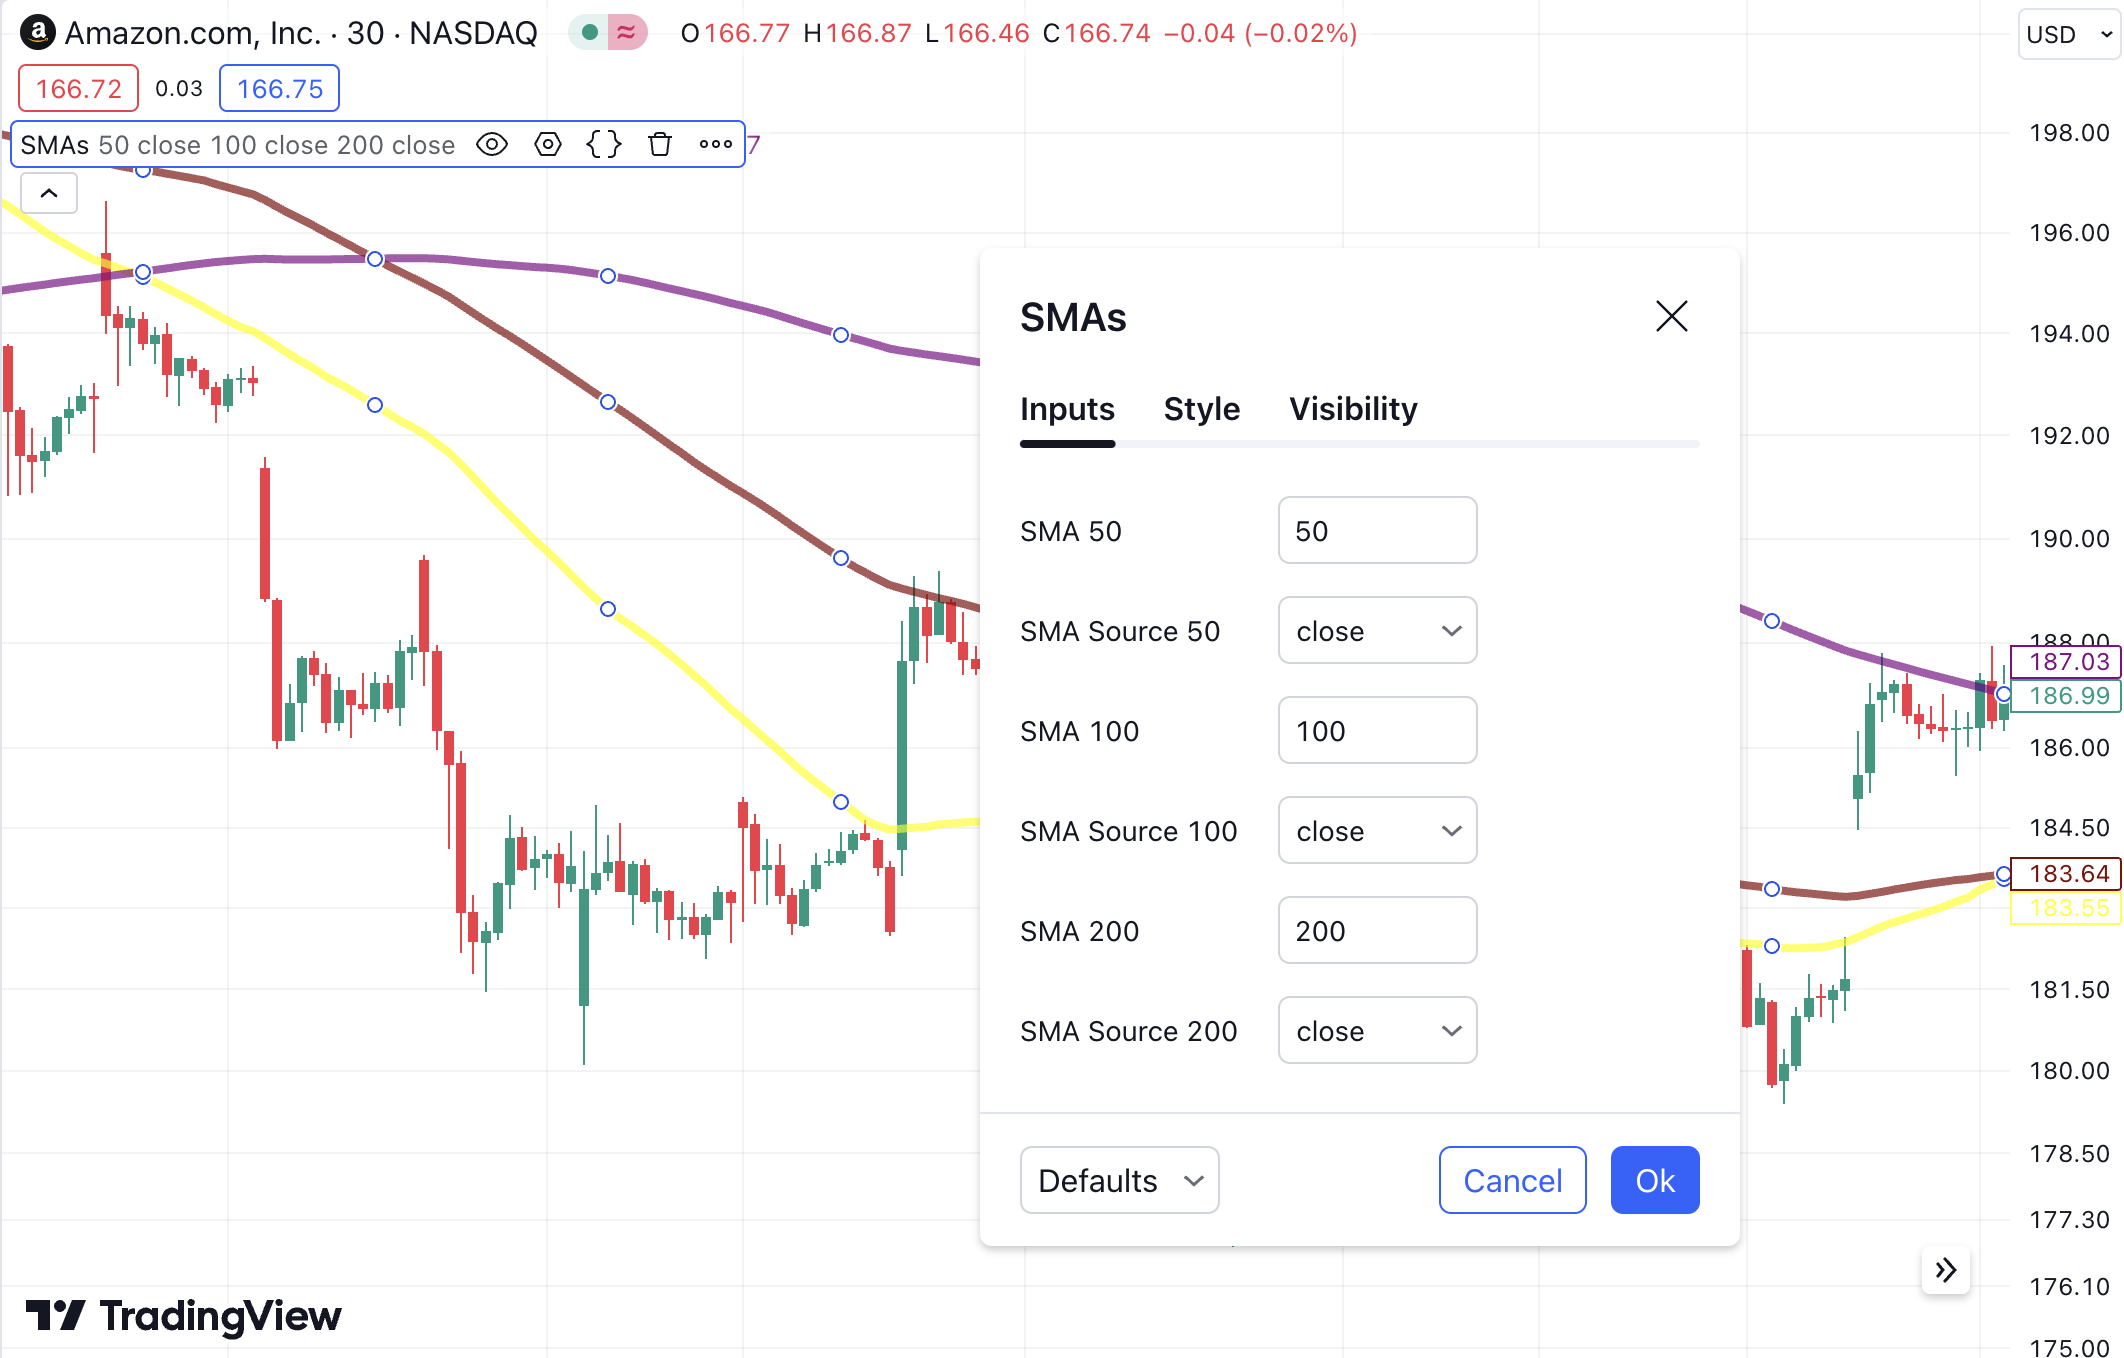
How to Use TradingView Indicators on Charts?
TradingView Indicators Benefits
Comprehensive Market Analysis
Graphical Representation
Customization of Indicators
Real-Time Data and Alerts
TradingView Community
Manage Risk Effectively
Educational Resources and Support
Top TradingView Indicators for Traders
Moving Average
Moving Average Convergence Divergence
Bollinger Bands
Relative Strength Index
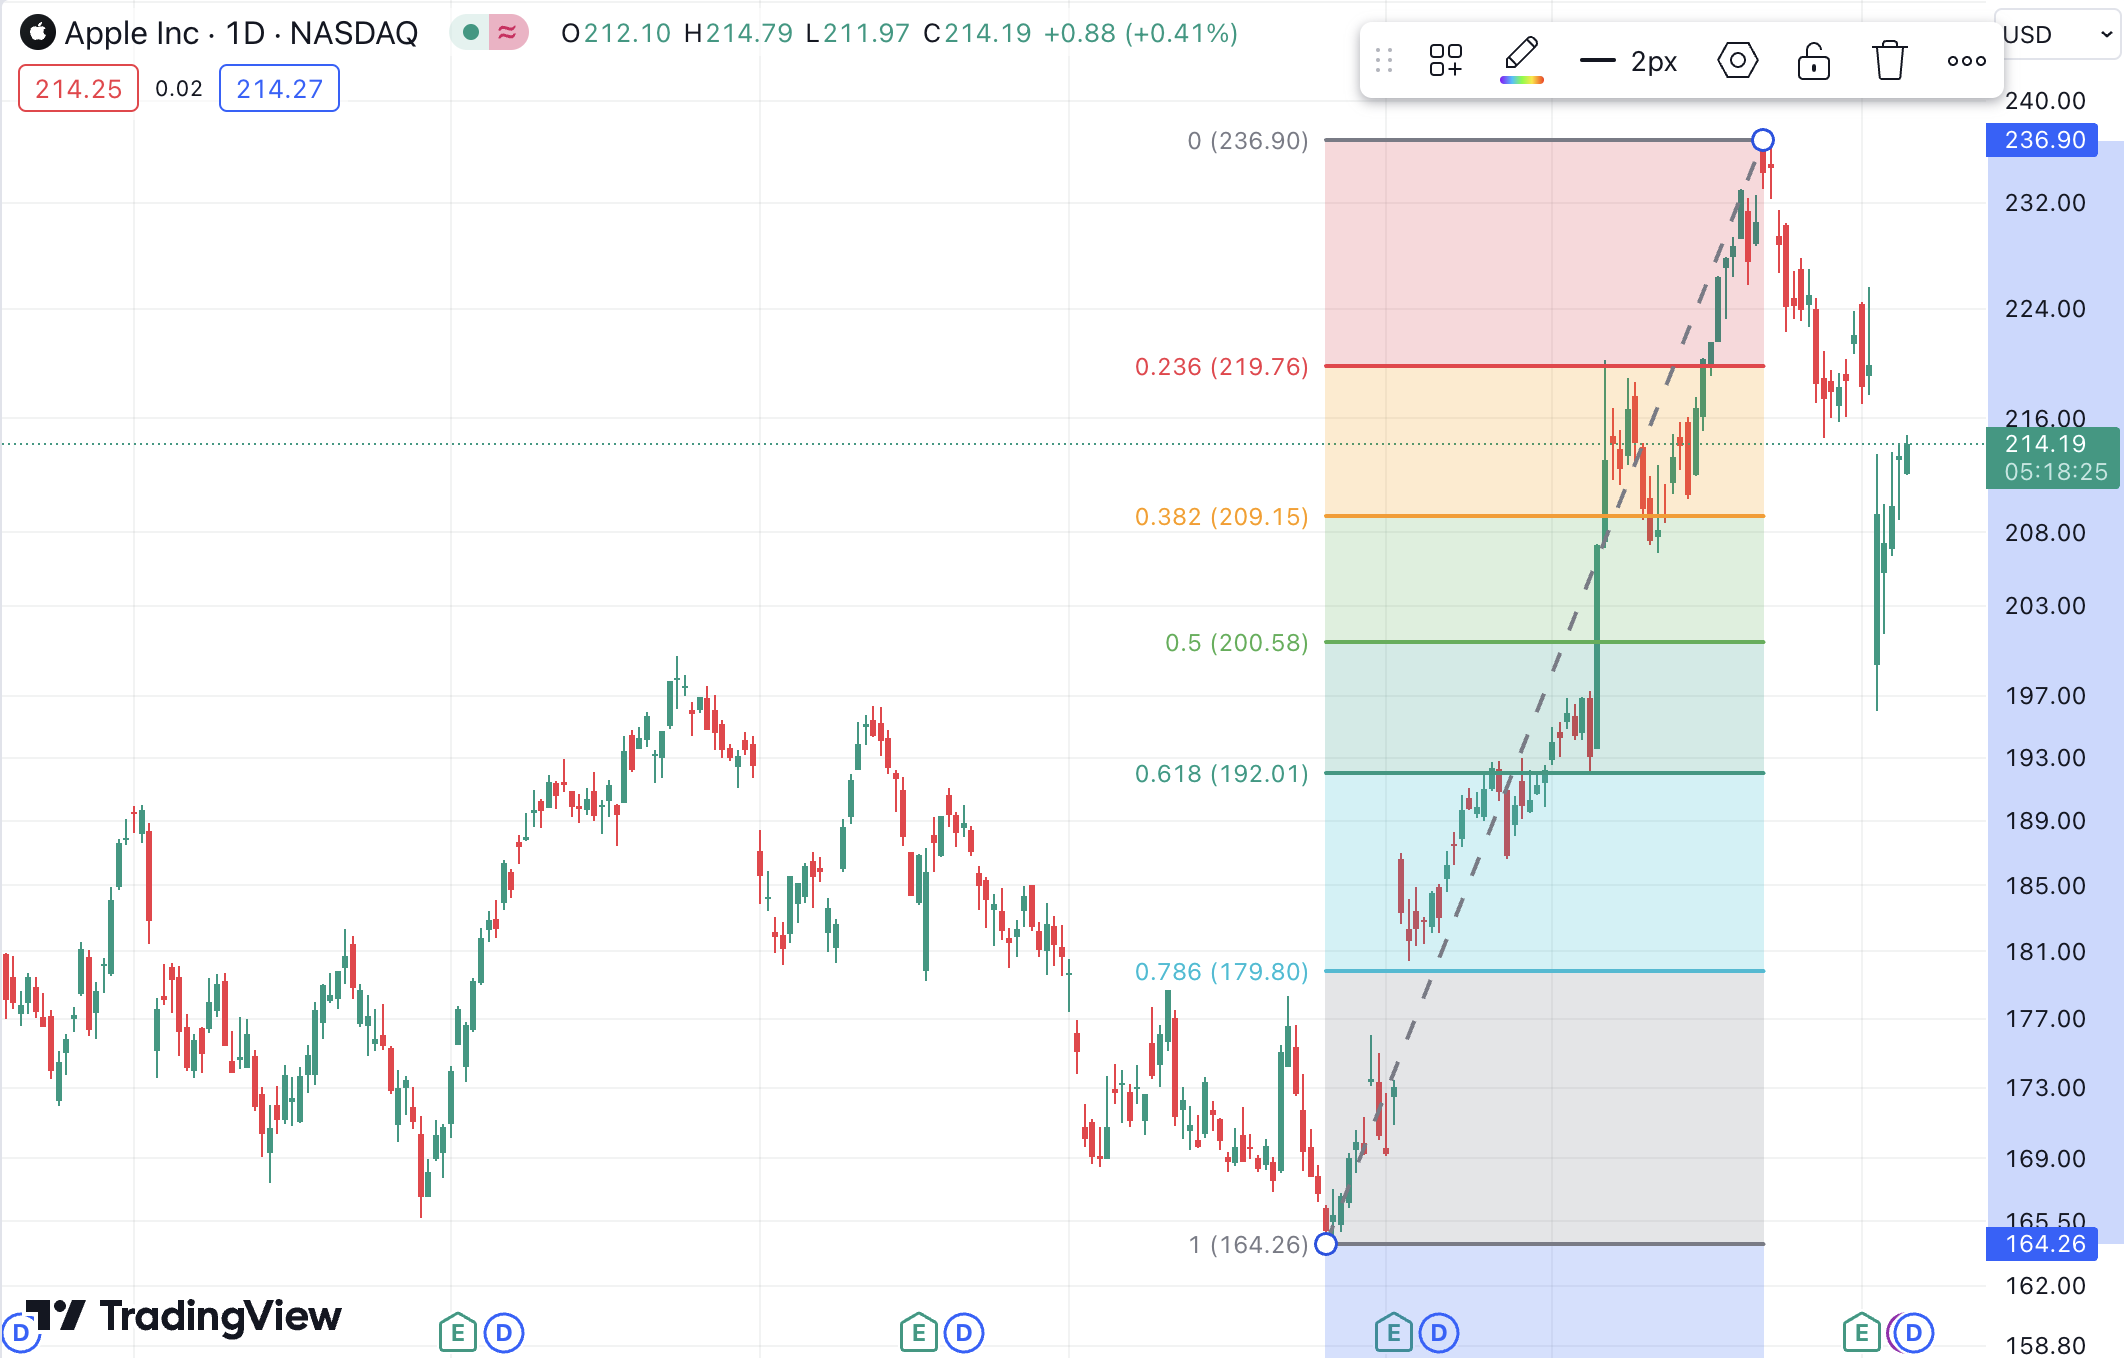
Fibonacci Retracement
Average True Range
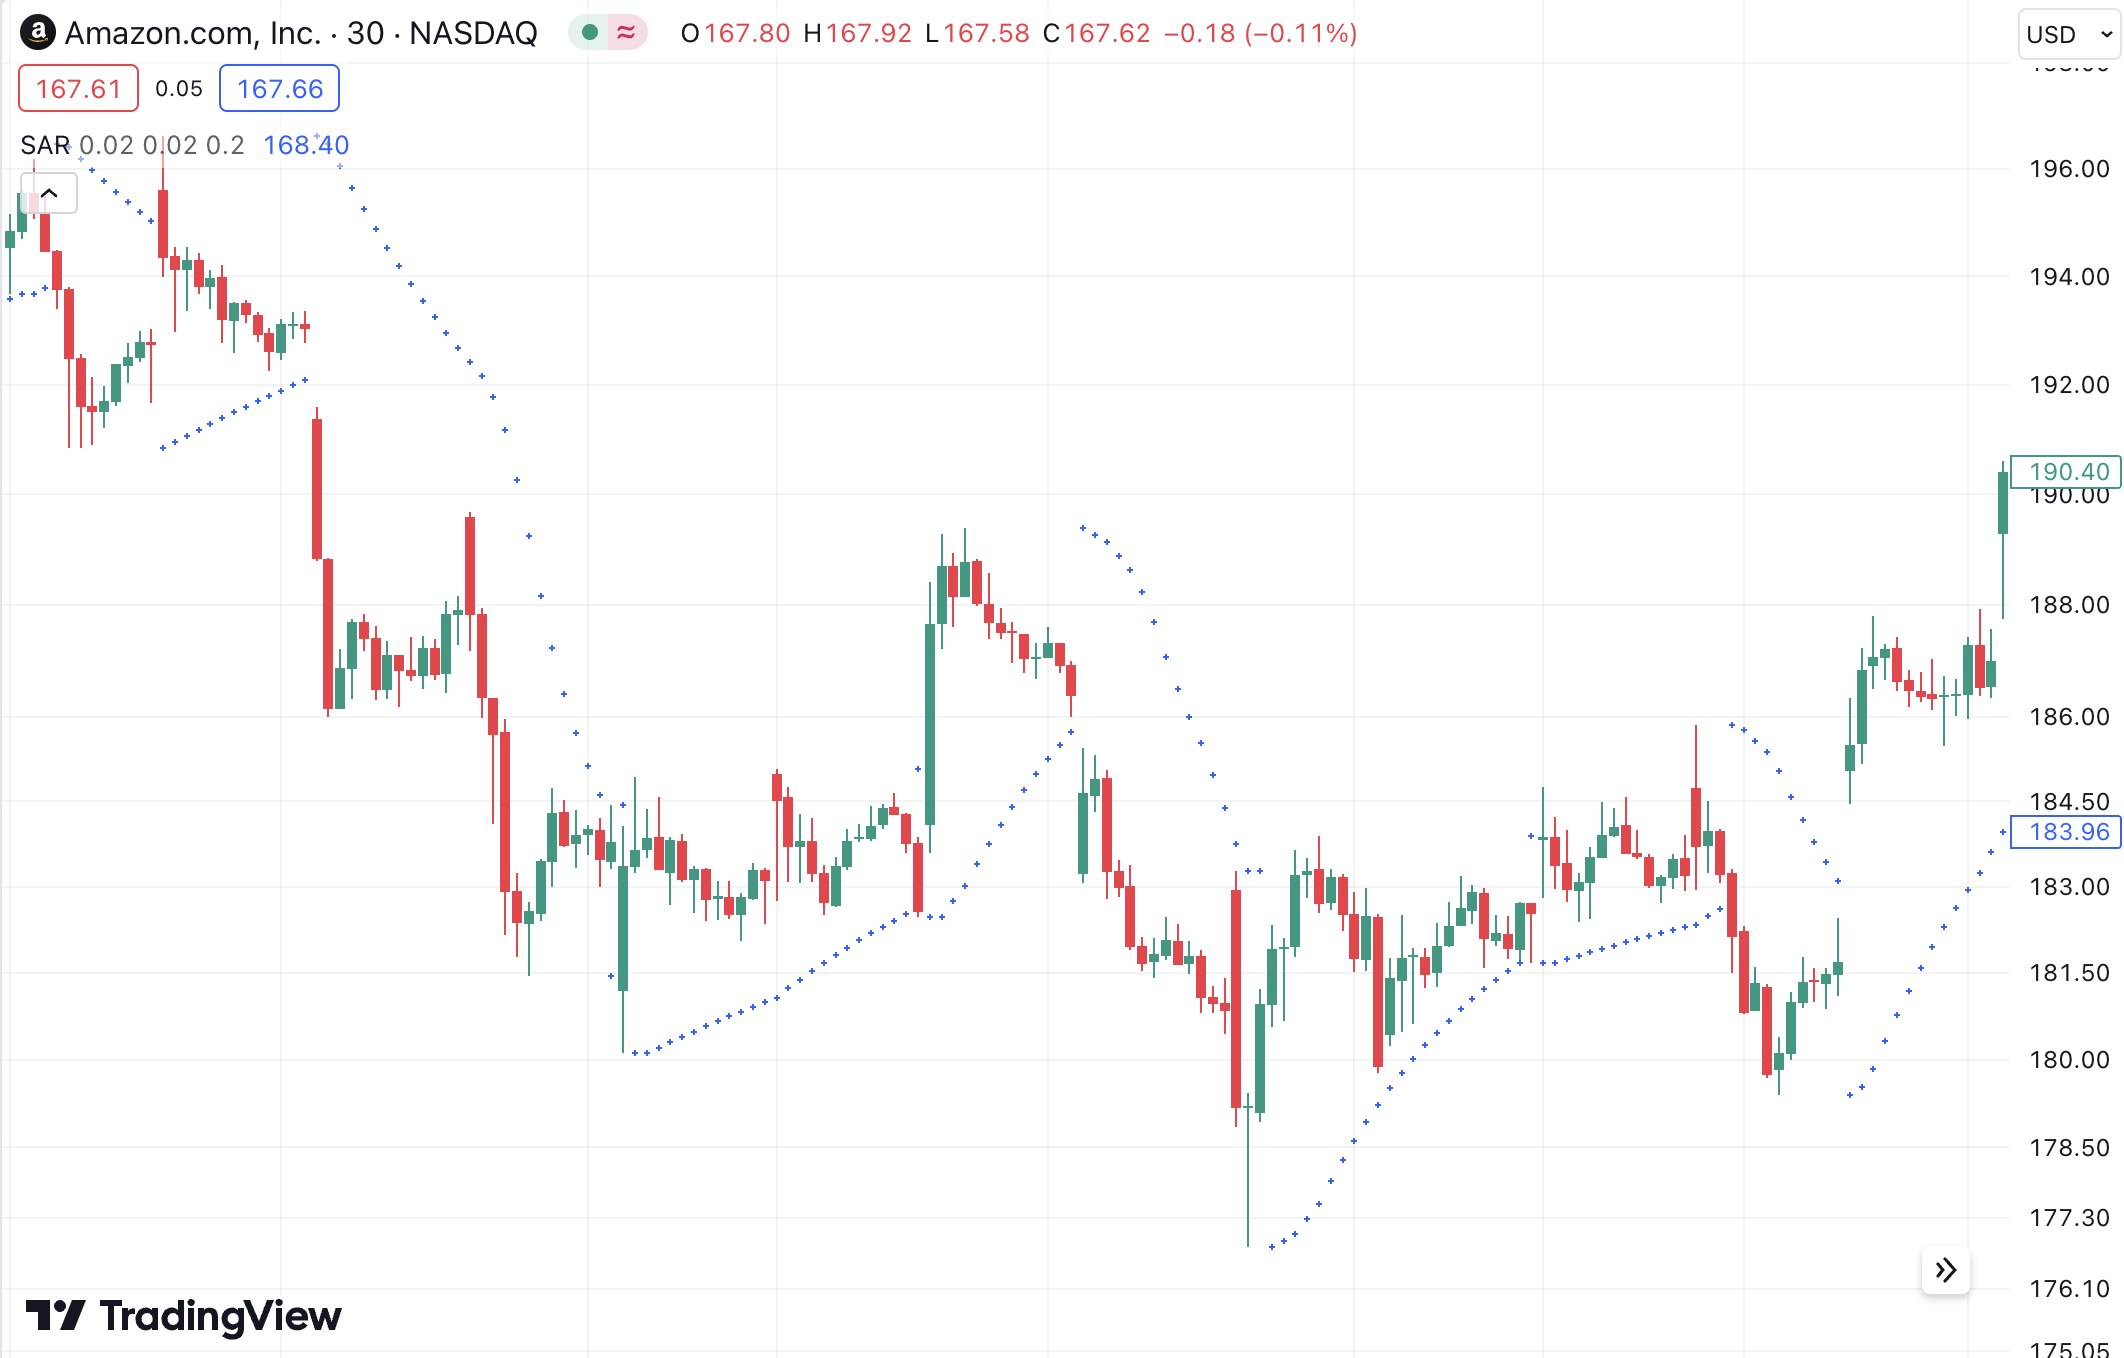
Parabolic SAR
On-Balance Volume
How to Choose the Best TradingView Indicator?
Understand Your Trading Style and Goal
Consider the Chosen Asset
Test Chosen Indicators
Tailor Indicators to Your Trading Plan
Combine TradingView Indicators
What are the Limitations of TradingView Indicators?
Lagging Signals
False Signals
Best Way to Trade Using TradingView Indicators
Conclusion
FAQs
How do TradingView indicators help in trading?
What is the best TradingView indicator?
How to use TradingView indicators?
Is it possible to customize TradingView indicators?