The concept of price action trading is relatively straightforward. In this strategy, traders make informed decisions based on the most fundamental element of market data – prices.
However, succeeding in price action trading demands a deep understanding of the market and its nuances.
In this guide, we explain everything about price action trading, its core principles, how it compares to other strategies, and what best practices to follow.
Price Action Trading – Key Takeaways
Why Price Action Matters in Trading?
Price action refers to the movement of a security’s value over time. This idea hinges on the premise that all market trends are reflected in the price fluctuation of an asset. For example, let’s take the case of a stock.
Any relevant information that might affect the stock’s performance, including the release of financial reports, market news, events, or sentiment, will be mirrored in its stock price. The same logic applies to all asset classes, such as commodities, indices, forex, and cryptocurrencies.
In other words, price action provides deep insights into market psychology. By studying price action patterns, traders can gauge the sentiment and behavior of other market participants. This understanding helps anticipate the market’s future trends.
What is Price Action Trading?
Price action trading involves buying and selling financial assets based on how their value fluctuates over time.
- These price fluctuations are typically represented on charts using candlesticks or bar patterns.
- Commonly, price action traders rely only on ‘naked charts’.
- In other words, traders believe that the movement or ‘action’ of the price is the most dependable tool for making decisions.
- That said, price action strategies are frequently combined with indicators to enhance trading accuracy.
Price action trading is a strategy that emphasizes developing strong market analysis skills. This is why mastering price action trading demands dedicated time and practice.
Getting Started With Trading Price Action
Now that we have established what price action trading is, let’s get into the finer details of this strategy.
Understanding Market Dynamics
To successfully trade price action, the first step is to understand what factors impact market dynamics. For those unaware, market dynamics refer to the forces that drive the behavior of financial assets.
As such, there are many factors to consider here – which we explore below.
Supply and Demand
No matter the asset class, supply and demand are the primary drivers of price action in the market. Simply put, when the demand for a security surpasses its supply, the price tends to rise. This is often characterized by aggressive buyers entering the market.
On the contrary, when supply surpasses demand, the asset price falls. In this case, you will see more sellers than buyers. Understanding the supply-demand balance is the first step to anticipating the future market dynamics.
Economic Data
Economic indicators can also provide insight into the future of the market. This includes data such as GDP growth, employment, inflation, and interest rates – which are closely watched by price action traders.
- For instance, if the GDP growth of a country is better than expected, it signals a strong economy. This can lead to a rise in broader stock market prices.
- Conversely, disappointing economic outcomes can lead to declines in the market. This primarily happens due to concerns about an economic slowdown and potential impacts on company earnings.
- The same applies to employment rates. Higher-than-expected job creation statistics typically boost market confidence.
- Whereas weaker employment rates trigger fears of economic stagnation, resulting in currency depreciation or falling stock prices.
Price action traders analyze crucial economic points ahead of their release and in real time. This helps them adjust their positions to align with market sentiment.
Geopolitical Events
Another facet to think of is geopolitical events, such as regulatory changes, elections, or global conflicts. These aspects can profoundly impact how an asset performs in the financial market. One notable example of this market dynamic is the 2016 Brexit referendum.
- The UK’s vote to leave the European Union caused significant turmoil in global markets.
- The British pound dived to its lowest level in over three decades, and stock markets worldwide experienced sharp declines.
- Not only that, the referendum result also led to volatility in bond markets and fluctuations in commodity prices.
Similarly, the COVID-19 pandemic also had a huge impact on the stock market. In March 2020, the S&P 500 went through one of history’s fastest and most severe market declines.
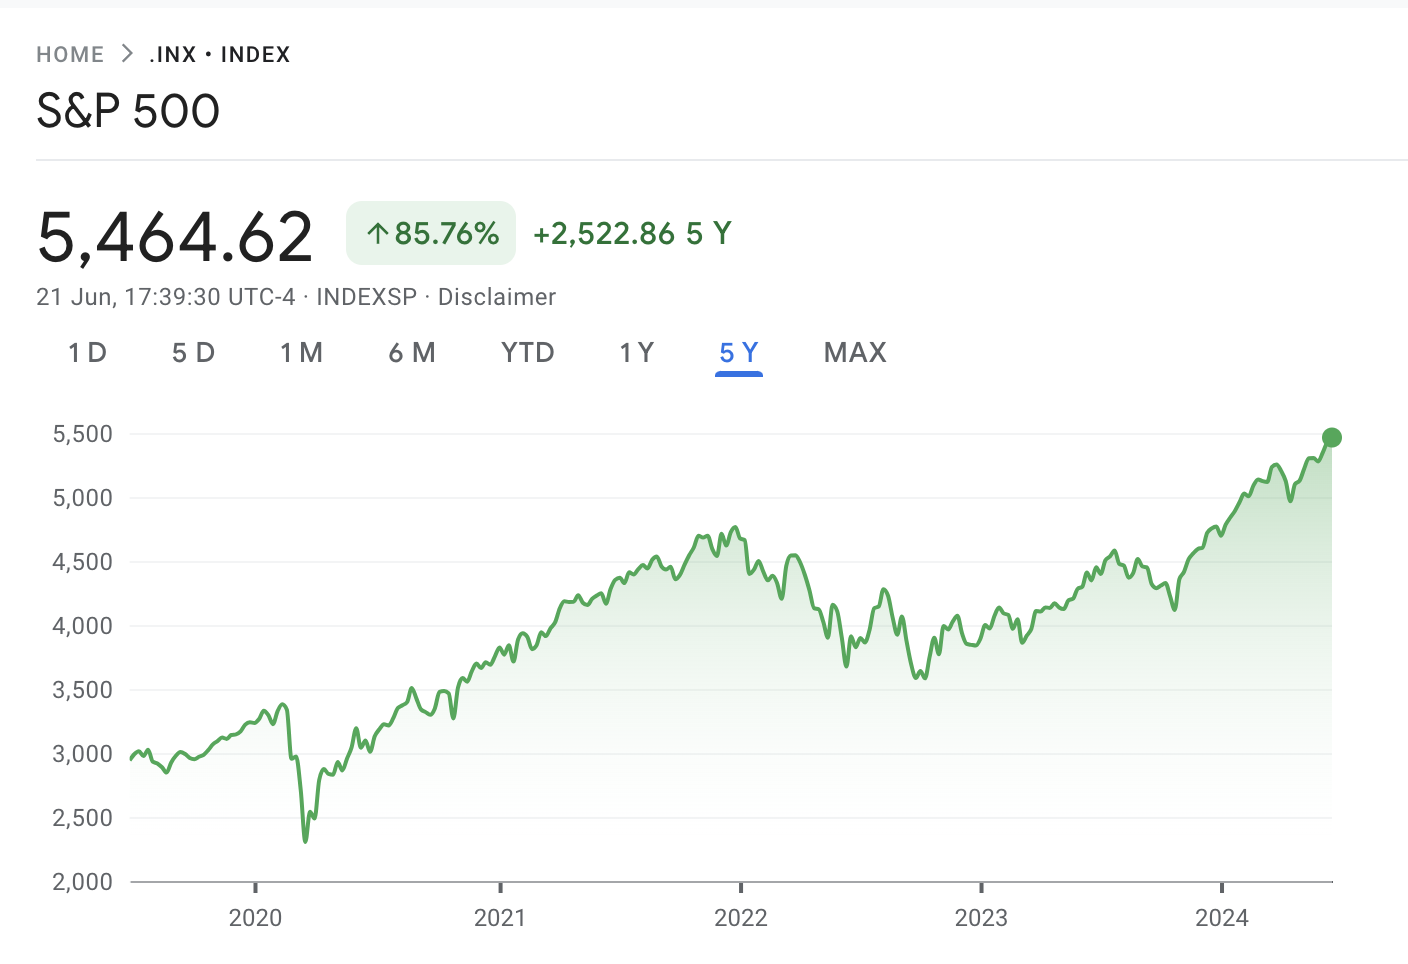
As the virus spread globally and countries started implementing lockdown measures, investor sentiment plummeted. This was due to concerns about economic shutdowns, corporate earnings, and overall market stability.
The influence of geopolitical affairs on economic markets cannot always be forecasted. However, regularly keeping up with financial and geopolitical news will help you prepare better when trading price action.
Asset-Specific Factors
In addition to broader market issues, each asset class is influenced by its specific financial and economic factors.
For instance:
- If you are trading the price action of a stock, then the company’s financial reports can impact its market volatility. Factors like layoffs, product launches, and even social media backlash have to be considered for stock trading.
- Agricultural-related events, such as weather forecasts and natural disasters can also play significant roles.
- Likewise, the crypto market can be influenced by government regulations or legal frameworks.
In other words, price action trading requires you to be on constant alert. This awareness is essential for making educated trading decisions and steering through the complexities of market dynamics.
Market Sentiment
Market sentiment pertains to the overall attitude of traders toward a specific financial asset. This sentiment can be driven by any of the factors we discussed above. Depending on the specific conditions, traders might be more inclined to buy or sell assets.
- A positive market sentiment typically occurs when investors are hopeful about the prospects of the specific assets.
- This optimism may be fueled by strong economic indicators, favorable earnings reports, or positive news developments.
- In such conditions, investors may lean towards buying assets, meaning rising prices and bullish market trends.
- On the contrary, negative sentiment arises when investors are pessimistic or cautious about market conditions.
- This attitude can be triggered by economic downturns, political tensions, poor corporate earnings, or adverse events.
- During negative market sentiment, investors may sell off assets or adopt a defensive stance. This further causes prices to decline and leads to bearish market trends.
That being said, market sentiment is not always rational. Despite the broader market-affecting factors, sometimes exaggerated price movements can happen.
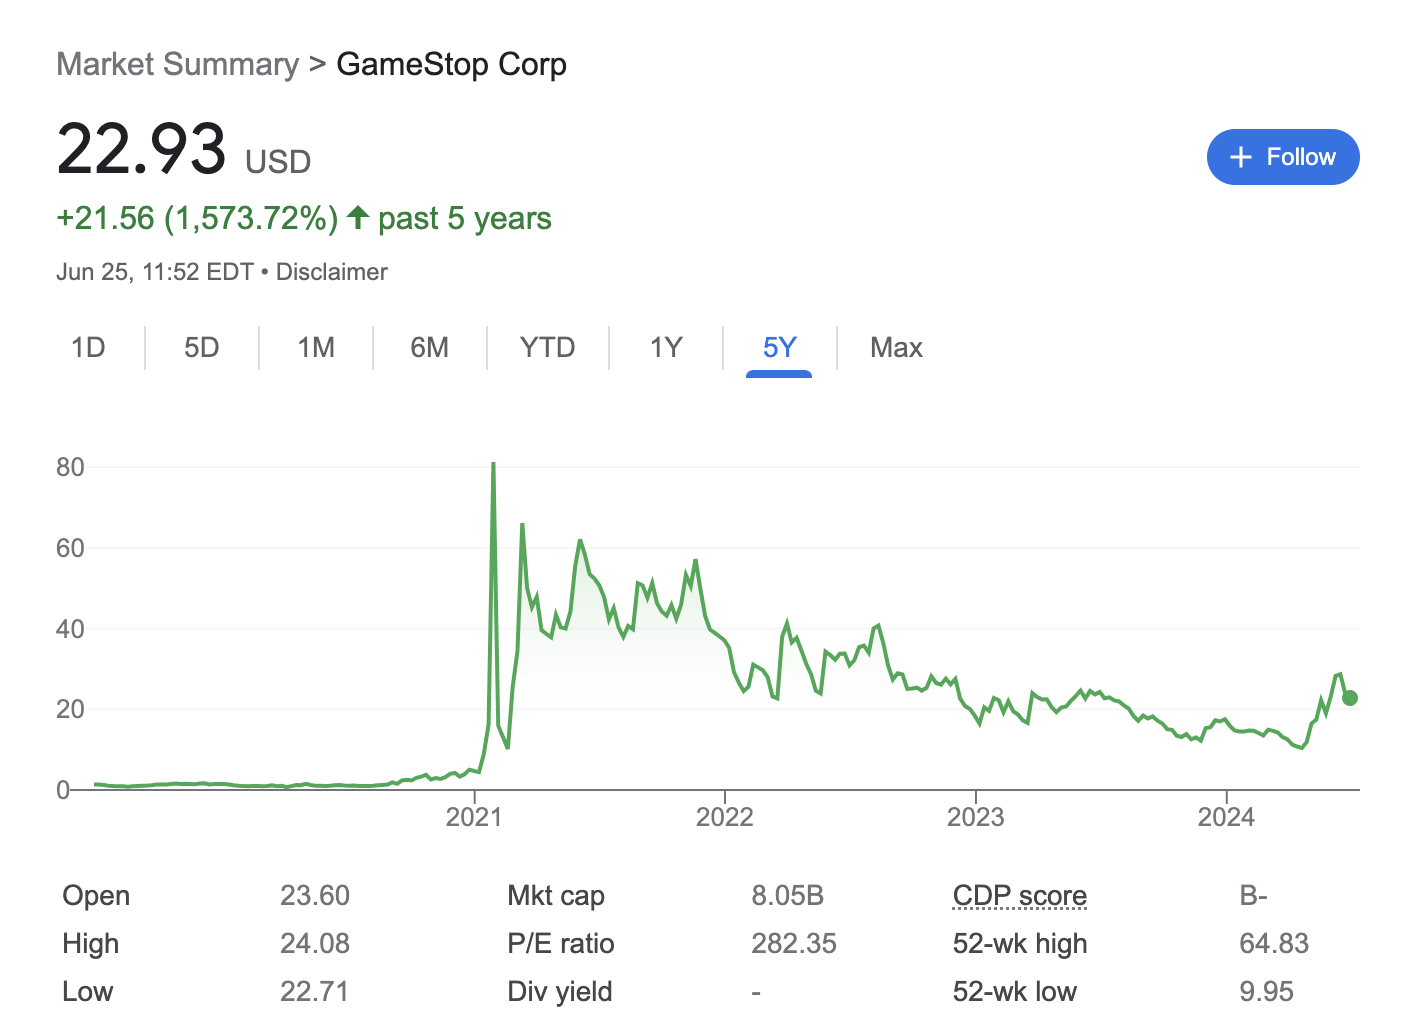
For instance, during the COVID-19 pandemic, meme stocks like Gamestop witnessed unprecedented heights. This sentiment didn’t align with the overall negative economic conditions. Nevertheless, traders who went against the current market sentiment made sizable profits.
Due to this unpredictability, financial analysts use a wide variety of tools to gauge market sentiment. This includes metrics like surveys, investor sentiment indices, options market activity, and technical analysis tools.
Key Principles Simplified
Once you’ve grasped market dynamics, the next step is to study the key concepts used in price action trading. These ideas are derived from the observation of price movements and patterns.
Here are some of the fundamental principles that can help in trading price action effectively.
Bullish and Bearish Trends
Wider market trends can be categorized into three key areas – bullish, bearish, and sideways.
- In a bullish trend, the price of the asset increases over time. This indicates optimism among traders.
- In a bearish trend, the value of the asset declines over time. This reflects pessimism among traders. This means the number of sellers is more dominant in the market.
- In a sideways market, the price of the asset often moves within a tight range. This is without making any notable bullish or bearish movements.
Recognizing these trends can help price action traders decide what kind of positions they should open.
Support and Resistance Levels
Price action traders should also equip themselves to spot breaks or reversals in trends. This is why support and resistance levels form the pillars of trading.
- A support level is where the downtrend price action is expected to pause or break. Once the support level is reached, the price of the asset can witness a reversal.
- A resistance level is where an upward movement is expected to halt. This is where the bullish trend line might break after facing selling pressure.
Support and resistance levels are derived from the historical price data. These could be levels where the price trends have reversed multiple times previously. After figuring out support and resistance levels, traders can utilize them to determine when to enter and exit a position.
For example, you can identify a resistance level and mark that as the entry point for a potential shorting opportunity. Alternatively, you could use the support level as the exit point for a long position.
Candlestick Charts
Price action traders mostly rely on candlestick charts when looking for patterns in the market. This is because candlesticks effectively visualize price movements. Each candle shows the open, high, low, and close values for the chosen time frame.
There are numerous candlestick patterns generated by the price movement of an asset. Each of these patterns sets up an expectation for what might appear next in the market. We discuss more about candlestick patterns in the later sections of the guide.
Tools for Trading Price Action
With the basics covered, let’s explore what tools you need to get started with price action trading.
Charting Software
The most fundamental tool required for trading price action is charting software. Most brokers have charts integrated into their platforms. This allows you to track the price action and make orders without having to leave the brokerage interface.
Consider the following when choosing the right charting software:
- Customization – Make sure charts are customizable, with different types and time frames.
- Drawing Tools – You should have access to drawing trend lines, support and resistance levels, and annotations.
- Pattern Recognition – Some software comes with pattern recognition features that can be overlayed on charts.
- Available Indicators – Many traders combine price action with technical indicators. This helps them get confirmation on their decisions. Therefore, ensure that your chosen charting tool also supports technical indicators.
Popular charting platforms like TradingView, MetaTrader, and NinjaTrader offer these features, providing traders with the tools to analyze price action effectively.
Price Action Trading Technical Indicators
While price action is a great indicator for analyzing the market, it’s wise to confirm signals with other tools. Technical indicators are incredibly useful in this context.
In this section, we discuss the best indicators used by price action traders.
Volume Indicators
Volume indicators tell you how many units of the chosen asset are traded in a given time frame. They provide information about the strength and intensity of market movements. When the price moves in a specific direction along with high volume, it demonstrates strong momentum and confirms the trend’s validity.
For instance, if the value of a stock is rising, then a steadily increasing volume suggests a strong surge in buying interest. Similarly, volume indicators are also used to spot trend reversals. Sudden spikes in volume, especially after a prolonged trend, could signal a potential reversal.
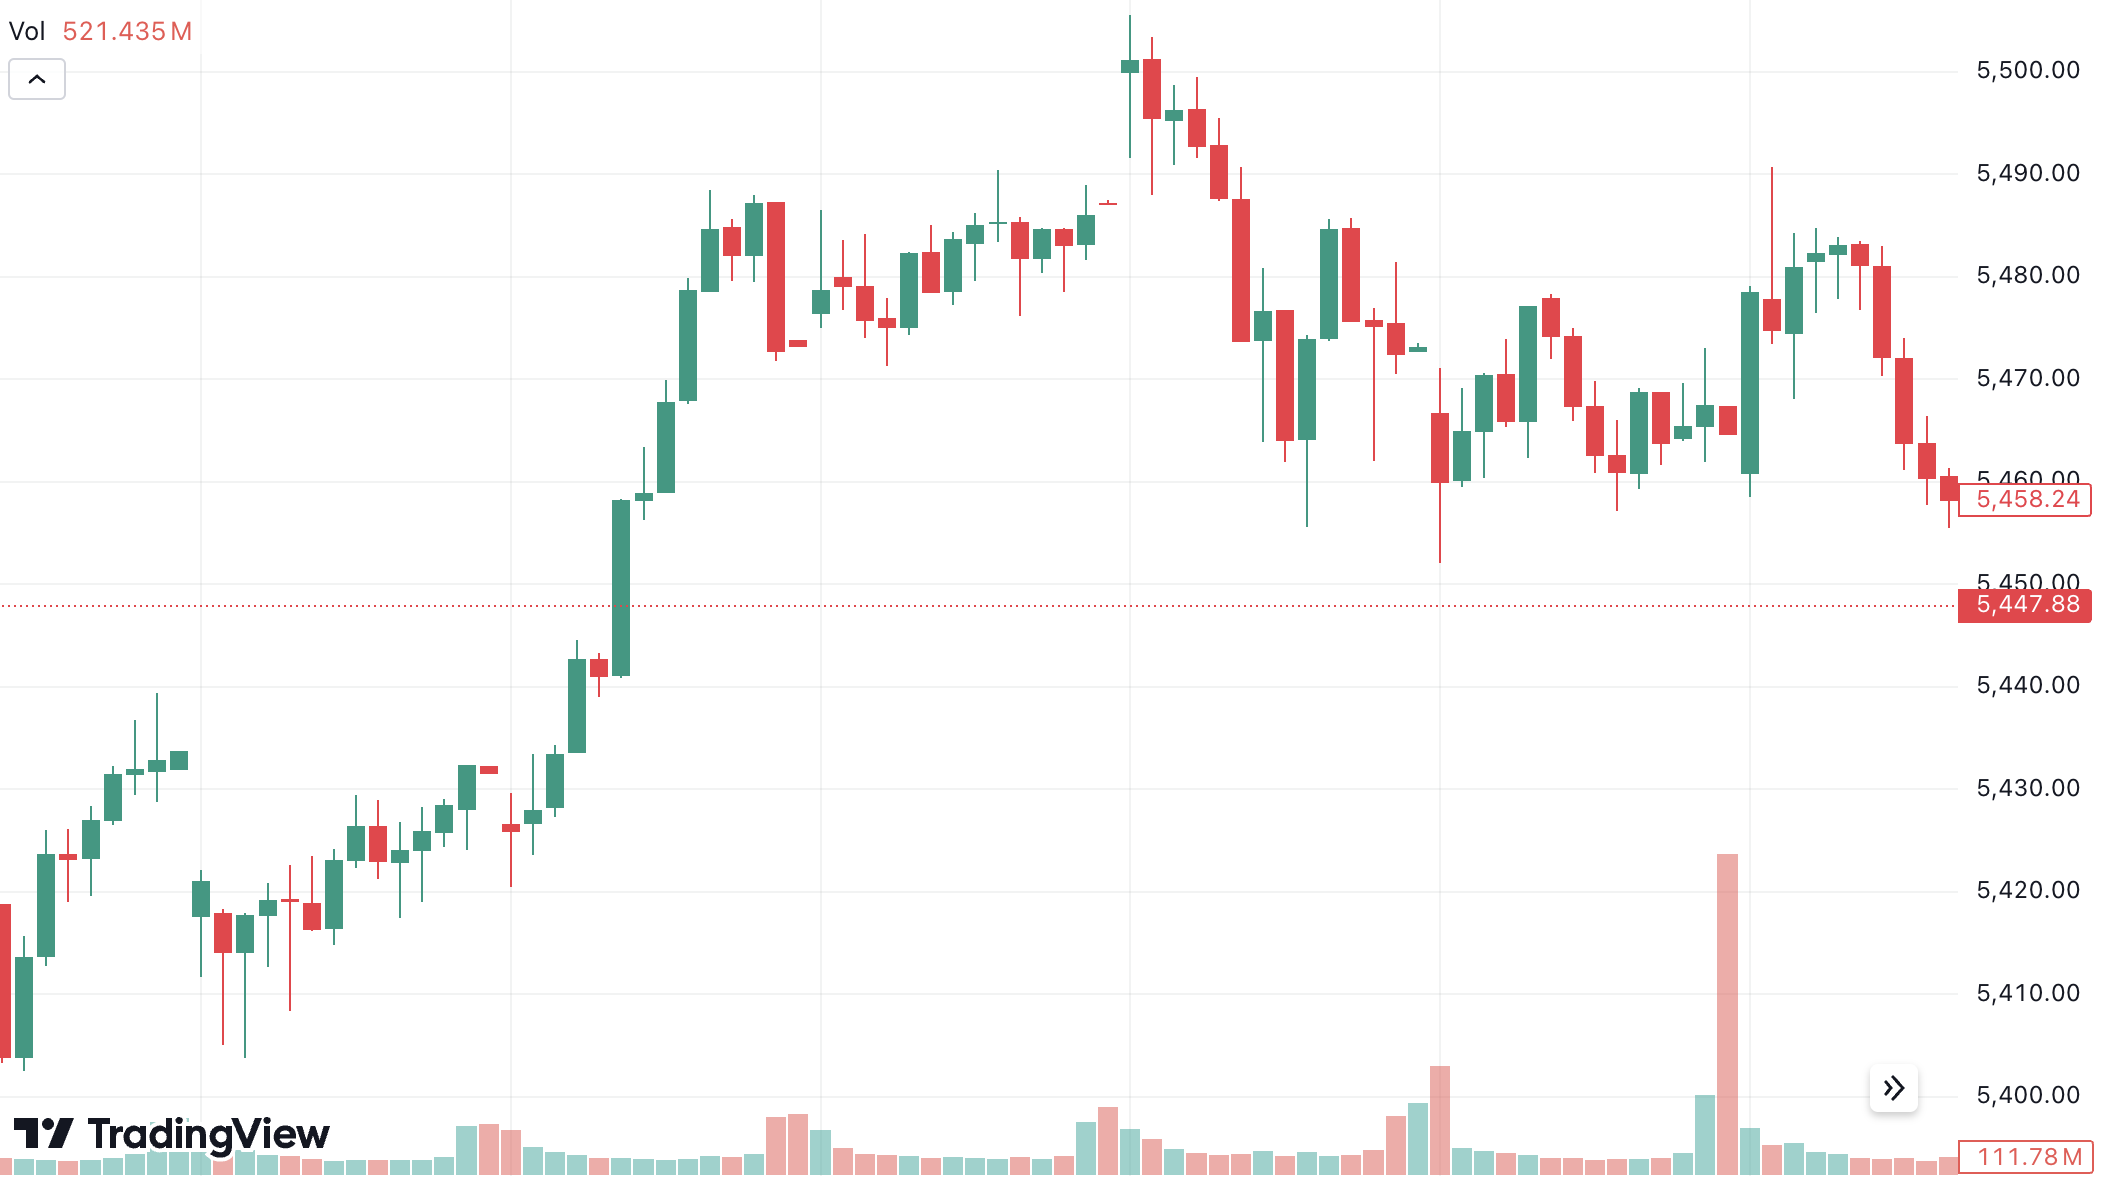
There are different types of volume indicators to help evaluate the strength or weakness of a price movement. This includes the On-Balance-Volume (OBV), the Volume Price Trend, Volume Weighted Average Price, and Volume Index.
Fibonacci Retracement
As mentioned, support and resistance levels are paramount in price action trading strategies. Fibonacci Retracement is a popular tool used to draw support and resistance levels. As the name suggests, this indicator is based on the Fibonacci sequence. The levels commonly used by traders are 23.6%, 38.2%, 50%, 61.8% and 100%.
Typically, Fibonacci retracements are drawn, connecting the swing lows and highs. The direction will depend on whether the trend is moving up or down. The chart below shows a downtrend for Apple stock. Here, the last downtrend is used to draw the retracement tool.
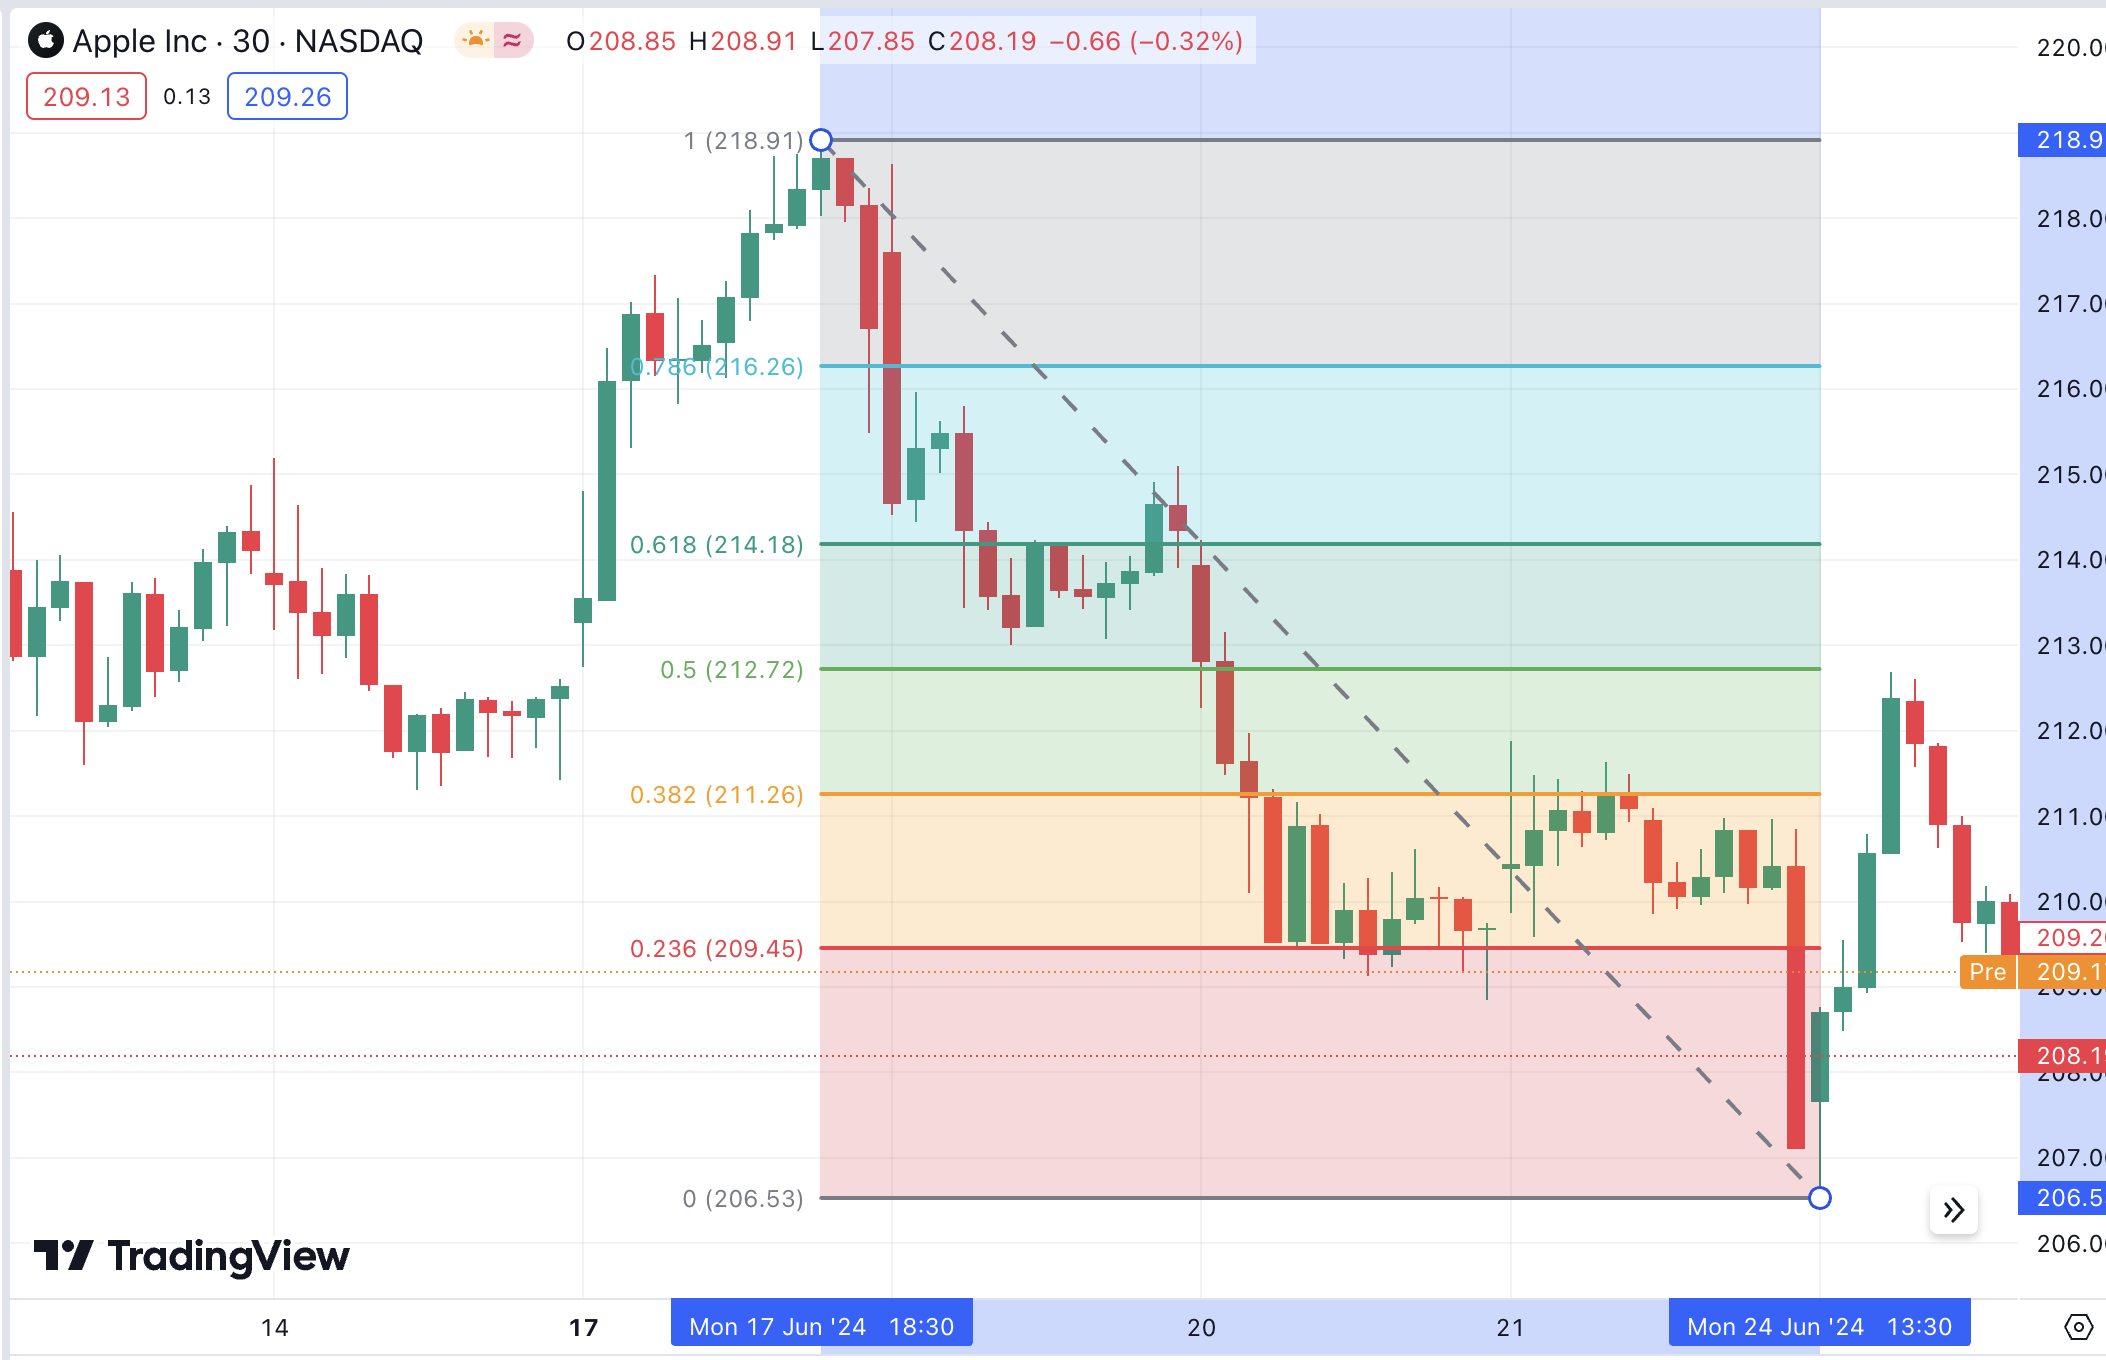
As you can see, the downtrend has experienced pullbacks along the Fibonacci levels. If the stock price falls back to one of these levels and then climbs upwards, then it could be a potential buying window.
You can also place stop-loss orders just above the subsequent Fibonacci level. For instance, if you opened a short position just above the 38.2%, place a stop-loss just below the 23.6% level.
Relative Strength Index
The Relative Strength Index (RSI) measures the speed and change of price action. The RSI moves between 0 and 100. This indicator is used to identify if a security is overbought or oversold.
- When the RSI goes above 70, it implies that the asset could be overbought. This indicates a potential pullback or reversal in trend.
- If the RSI goes below 30, it indicates that the asset could be oversold. This can suggest a potential price bounce.
The RSI is also used with other indicators to confirm signals. For example, if the price of an asset is reaching a resistance level and the RSI is in the overbought territory, then it could strengthen the case for a short position.
Stochastic Oscillator
The Stochastic Oscillator is another indicator used to measure momentum. On a chart, the Stochastic is represented by the %K line. There is also a %D line, which shows the moving average of %K.
- When %K goes above %D and moves past the 80 level, it signifies that the asset is overbought. At this time, traders can watch out for a potential reversal or pullback.
- In the reverse scenario, the Stochastic might move below %D and the 20 level. In this case, it suggests the asset is oversold.
For example, if you are contemplating a long trade, you can wait until the %K line goes above the %D level. This suggests that upward momentum is strengthening. This alignment can be interpreted as a bullish signal, pointing to potential buying pressure.
Moving Averages
Moving averages can also be used to spot market trends. Not to mention support and resistance levels. Two commonly used types are the Simple Moving Average (SMA) and the Exponential Moving Average (EMA).
When using moving averages, you need to define the time frame. For instance, this could be a 10 or 15-day period.
For example:
- Let’s say you’re using a 10-day SMA for a stock.
- When the market is in an uptrend, you observe that the price consistently stays above the 10-day SMA.
- If the price retraces back to the SMA, then this could serve as support.
- Similarly, if the price of an asset remains below the SMA during the downtrend, then it would serve as the resistance.
- In this case, if the price of the asset climbs near the SMA level, it could open a potential selling opportunity.
The EMA, on the other hand, gives more significance to recent price data than the SMA. This is why the EMA is more responsive to real-time price action.
Bollinger Bands
Bollinger bands are used to determine the volatility and relative price levels of a financial asset. It consists of three bands – the lower, upper, and middle lines. The middle is usually a 20-period SMA. The upper and lower lines are placed above and below this middle line.
The bands widen and narrow based on the volatility of the underlying asset. When the banks become narrow around the price action, it indicates low volatility. This squeeze could suggest a significant upcoming price movement – such as a breakout or breakdown in the price.
On the contrary, if the space between the bands widens, this means high market volatility. Moreover, If the price of the asset extends beyond the outer bands, you can look for opportunities to trade back to the middle band.
Essentially, all you need are charts to start trading price action. However, to learn from your trades and improve over time, it’s wise to record your actions. And a trading journal can be immensely effective in that. This applies to all kinds of trading strategies, not just price action. A trading journal can be used to record your daily trades. This includes the entry and exit points, position sizes, and outcomes. You can also note down any notable trading successes or mistakes. By consistently reviewing and examining your trading journal, you can learn from your experiences and enhance your skills.Trading Journals
Price Action Trading Strategies
Wondering how to get started with price action trading? Here are the most commonly used price action strategies to try.
Trend Trading in Price Action
Trend trading is fundamental to the price action strategy. The main goal is to enter trades aligning with the ongoing trend. The question is, how do you find the trend and ensure that it’s correct? Put simply, this is where you can use trend lines.
Trend lines are drawn on charts to connect a series of candlesticks. These lines help you visualize the market direction and the possible support or resistance levels. A trend line should link at least two points of the price movement.
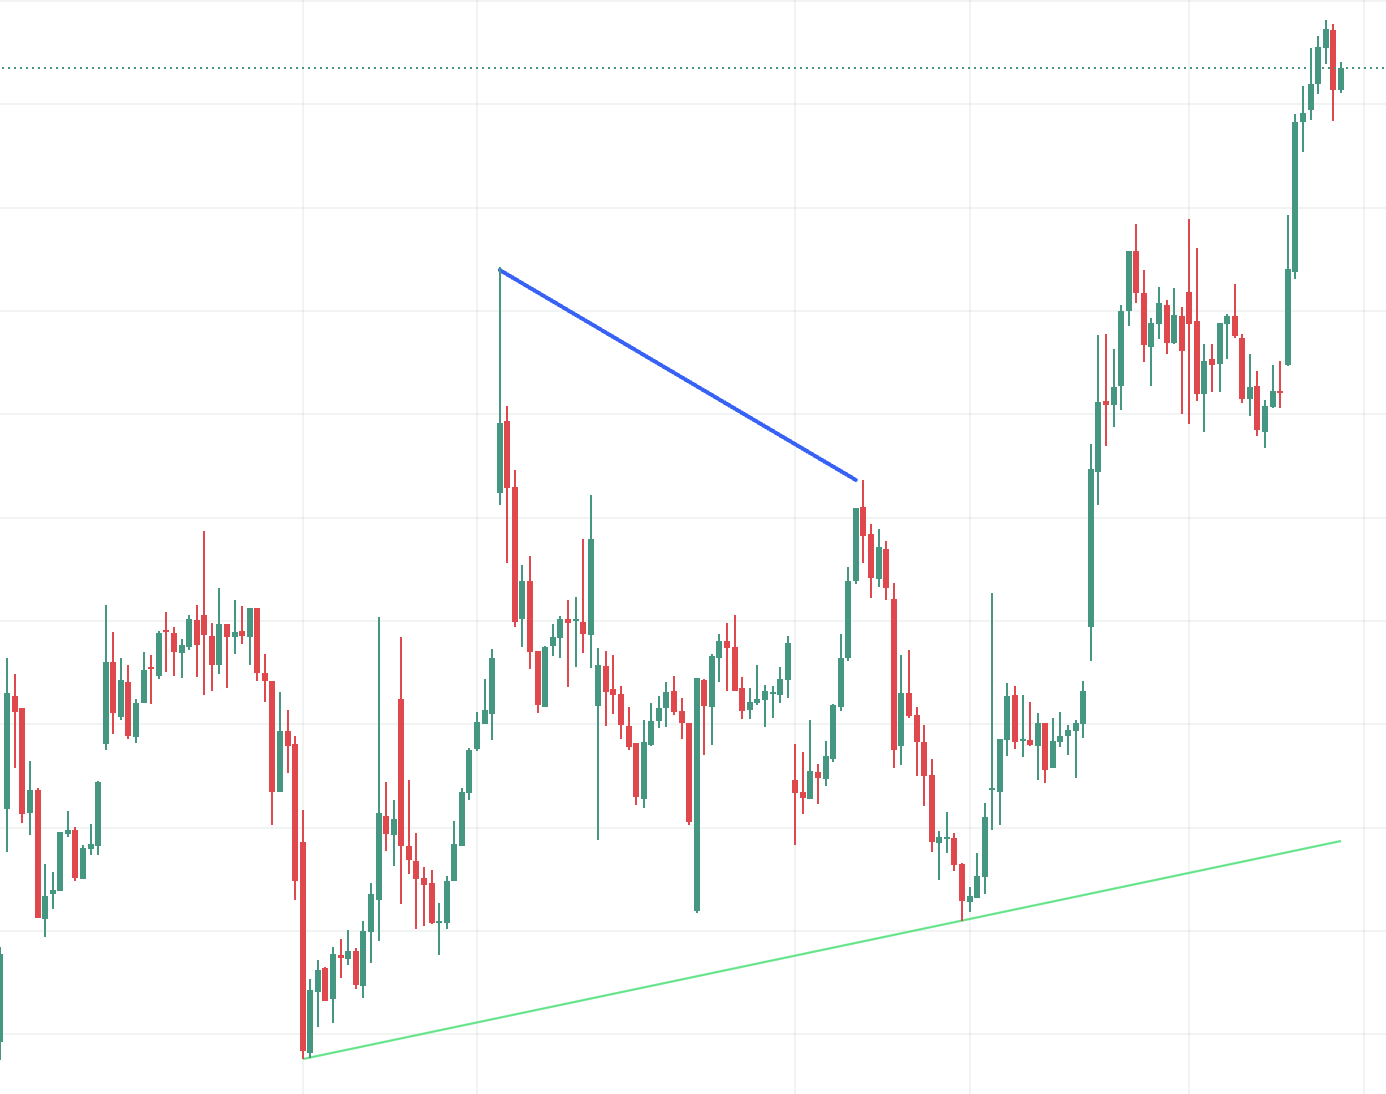
The more points you can connect with a single trend line, the stronger the market direction is. Moreover, when using trend trading, you can also look out for the break of the line, which could indicate a reversal.
On the other hand, if the price returns to a trendline, it could suggest a continuation of the trend. These insights help traders time their entry and exit points more effectively.
Support and Resistance Strategy
We’ve established that support and resistance are key levels in price action trading. Let’s explore how to use this information when opening and closing trades.
- If you are opening a long position, you can set the entry price close to the support level.
- Then, consider setting the take-profit order just below the next resistance level.
- You can also put a stop-loss order just below the closest support level.
In this strategy, you are expecting the price to reverse or consolidate once it meets the resistance level.
- On the contrary, if you are opening a short position, the strategy would be to sell near the resistance level.
- Then, you can close the trade when the price meets the support level.
This method is ideal for beginners, as it doesn’t require any other indicators.
Identifying Candlestick Patterns
We explained how candlestick charts play a key role in price action trading strategies. This is because each pattern is interpreted differently, allowing traders to make informed decisions.
Below, we delve into common candlestick patterns and their importance.
Hammer Candlestick
A hammer candlestick is depicted as a long wick or shadow and a small body. The wick represents price rejection or reversal from a critical level.
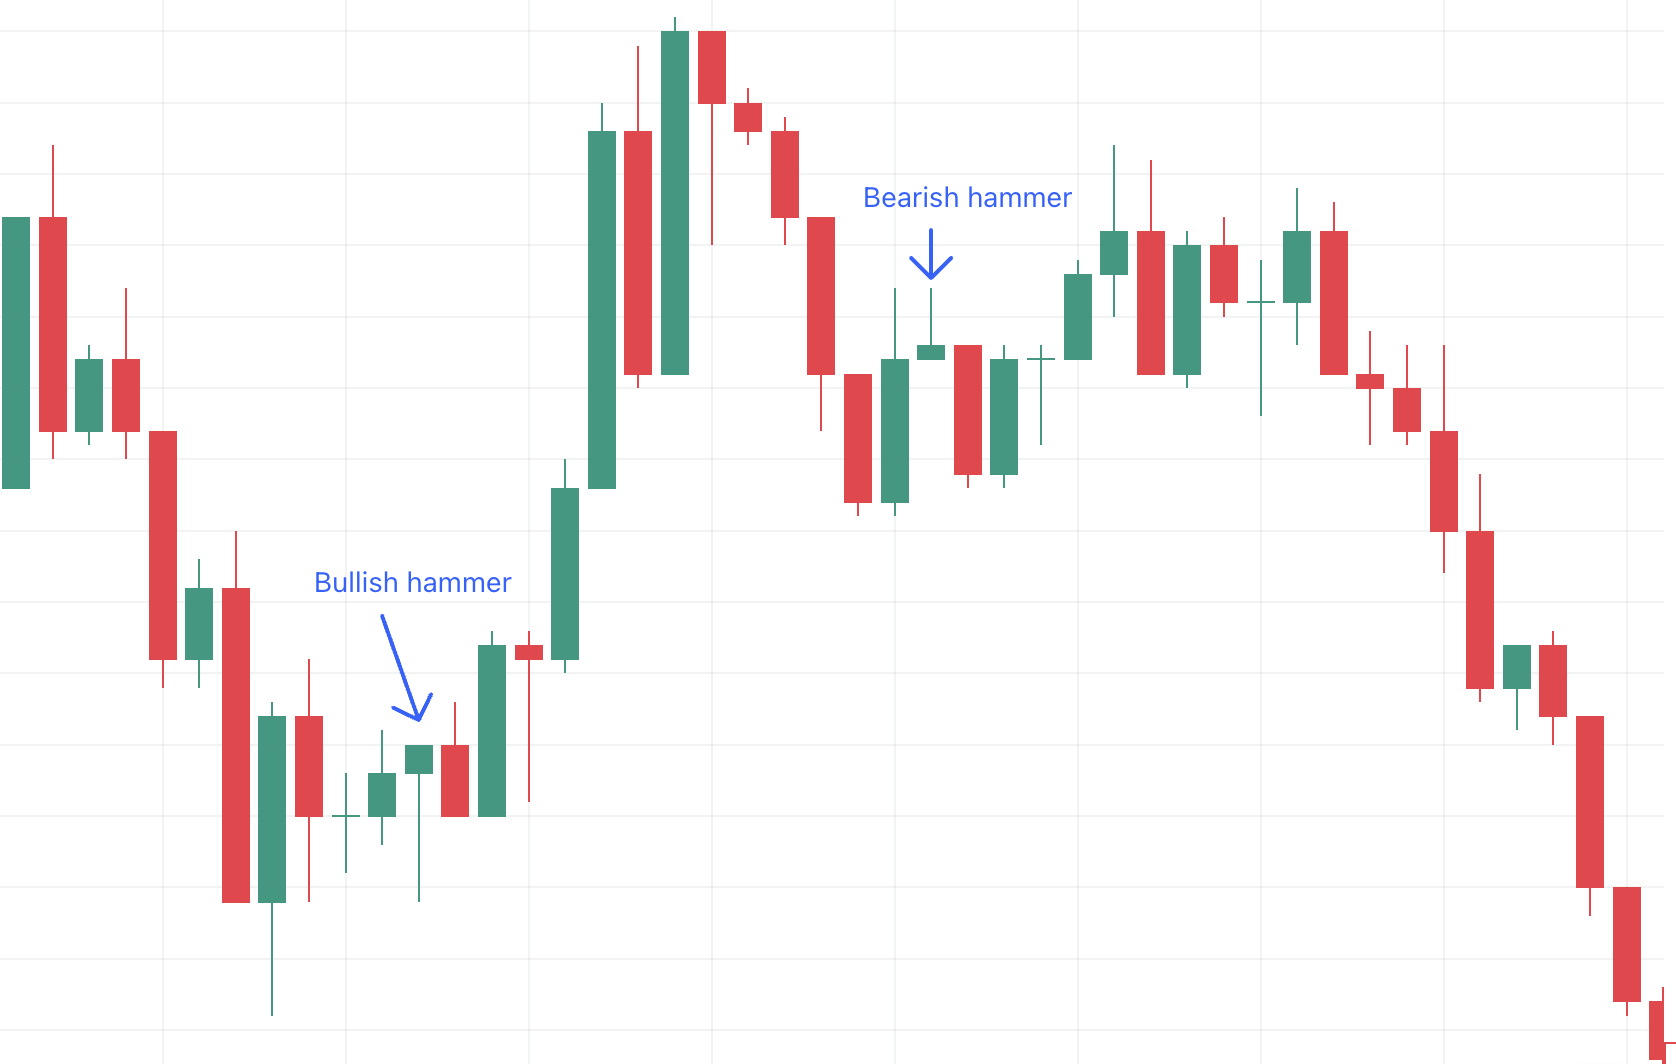
A bullish hammer forms when the lower tail is long. This indicates the rejection of a lower price and a potential upward movement. Conversely, a bearish hammer has a long upper tail. This suggests the rejection of a higher price and a potential downward movement.
Railway Track
The railway track candlestick is composed of two consecutive candlesticks with almost equal lengths but opposite directions. In essence, the two candlesticks should be of different colors. For instance, if the first candle is green (bullish), the second should be red (bearish), and vice versa.
This pattern resembles parallel railway tracks, hence the name. A railway track candlestick is an indicator of a trend’s reversal.
For example, in an uptrend, the first bullish candlestick can suggest a continuation of the trend. However, if it’s followed by a bearish candlestick of the same size, then it denotes strong selling interest. This could mean a potential shift to a downtrend.
Doji
A Doji candle pattern is formed when the opening and closing values of an asset are practically the same. This candle has a very small or nonexistent body, with long wicks on either end. The length of the wick can vary, depending on market conditions.
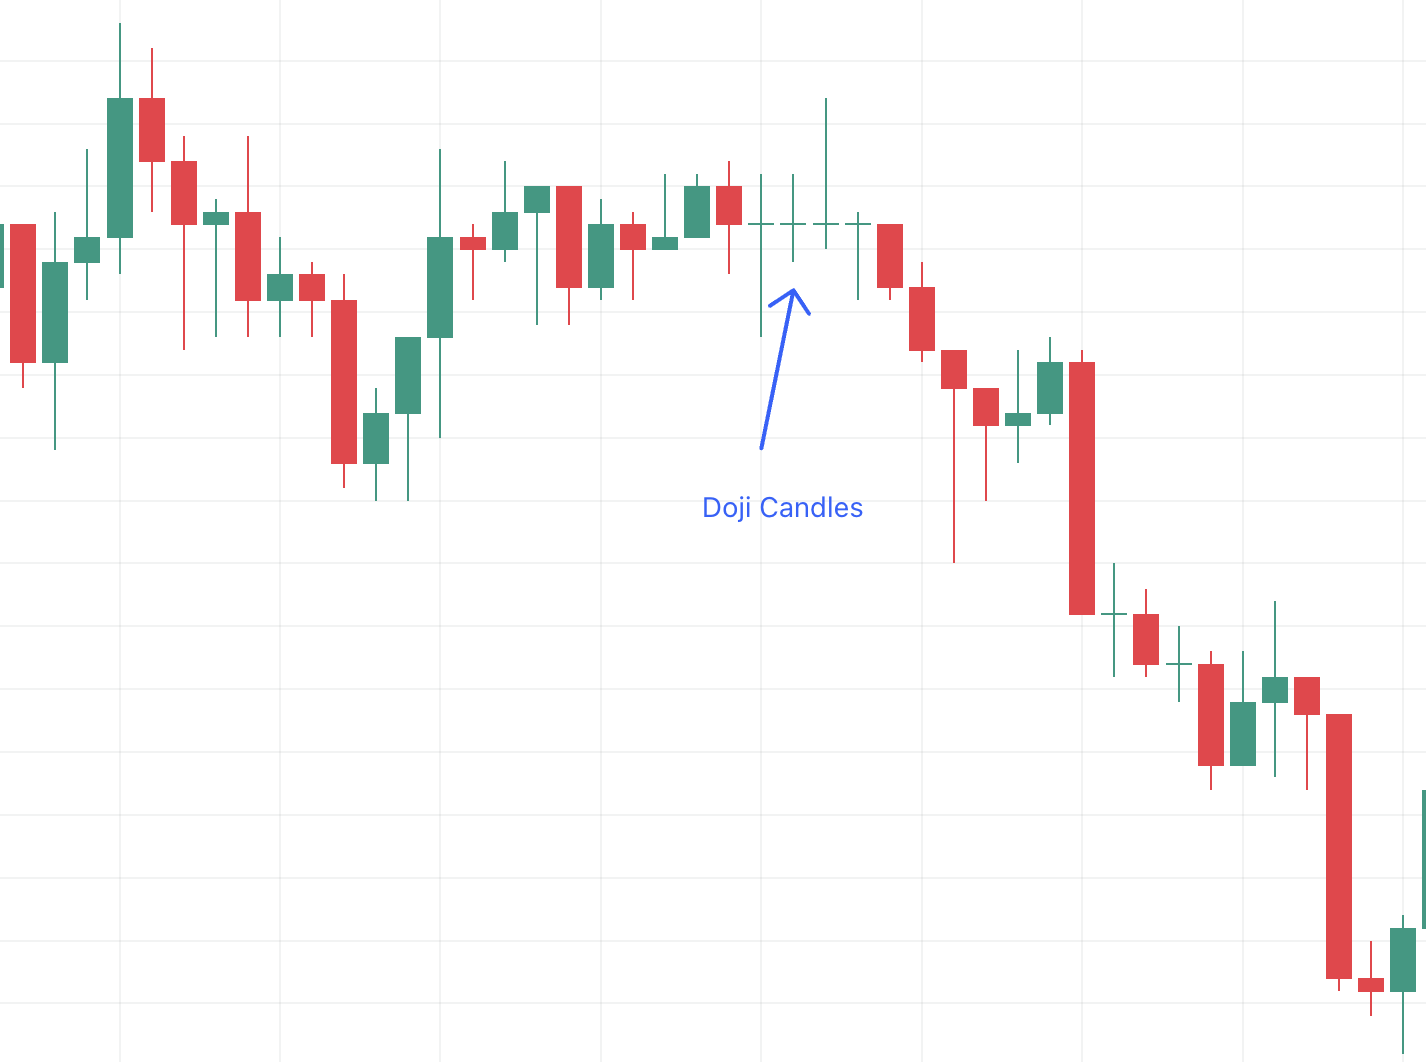
Typically, a Doji candle represents indecision in the market. In other words, it shows that neither buyers nor sellers have acquired control. Regarding price action, a Doji candle often signals a period of consolidation or a possible reversal.
For instance, if Doji forms at the end of an uptrend followed by a bearish candle, this could mean a potential sell signal.
Morning Star and Evening Star
The morning star is a powerful candlestick pattern that predicts potential price reversals. This bullish reversal pattern is usually found towards the end of a downtrend.
It comprises three candles:
- A long bearish candle, which indicates strong selling pressure.
- A small-bodied candle in the middle can be bullish or bearish. This shows indecision or a pause in the trend.
- A third candle is long and bullish, opens above the second, and closes along the body of the first. This indicates a strong buying pressure or the potential beginning of an uptrend.
The evening star, on the other hand, suggests that the uptrend may be breaking and a downtrend could be beginning.
Engulfing
The engulfing pattern has two candlesticks, with one bigger than the other. Put otherwise, the second candle completely overshadows the body of the previous one. This could be either bullish or bearish engulfing patterns.
If the first candlestick is bearish, which is followed by a larger bullish one – this could indicate a potential reversal of a downtrend.
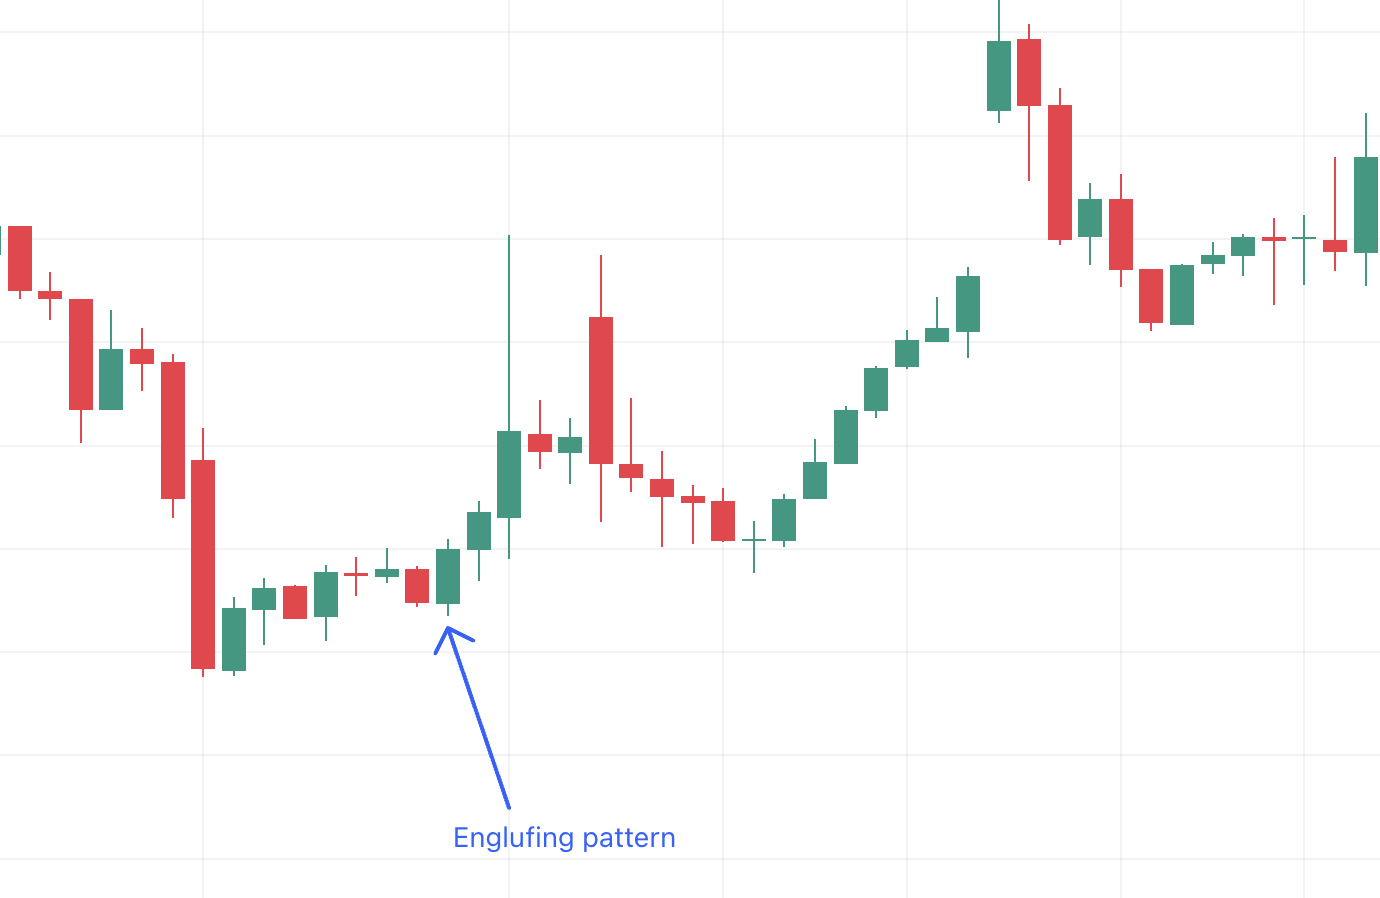
On the contrary, a bullish candle engulfed by a bearish one indicates the potential end of an uptrend. Traders typically look for these patterns at key support or resistance levels to confirm their entry and exit points.
The strategies and tools discussed above are only a few used in price action trading. You can combine price action trading techniques with other indicators and chart patterns to develop your own strategies.
Advantages of Price Action Trading
Here are some reasons why the price action trading strategy is so popular.
Simplicity and Clarity
As mentioned, price action trading is best known for its simplicity. In this strategy, you focus mainly on price movements. For many traders, especially beginners, relying on technical indicators might be challenging.
Since price action trading focuses on one factor, the charts provide clear and direct signals. This makes it easier for traders to place entry and exit points.
Adaptable to Various Markets
Price action trading strategies are relevant to different asset classes. This includes stocks, forex, commodities, cryptocurrencies, indices, and derivatives like CFDs, futures, and options.
It also allows traders to quickly adapt their strategy to changing market conditions without adjusting any indicator settings.
Works With Multiple Trading Strategies
Price action trading is highly versatile and can be effectively integrated with various trading strategies. Whether you’re a trend follower, a swing trader, or a scalper, price action analysis can provide valuable insights and enhance your trading decisions.
This adaptability allows traders to use price action techniques in conjunction with other trading methods, such as support and resistance levels, chart patterns, candlestick formations, and so on. Moreover, price action strategies can accommodate different levels of expertise.
While price action trading is simple and versatile, it also has downsides. Notably, analyzing price action is highly subjective. Traders may decipher the same price history differently, potentially leading to varied decisions that could contradict market movements. Additionally, historical price data isn’t always a guarantee of the same future outcomes. This is why traders should employ multiple tools to confirm their positions. Furthermore, traders should use risk management practices to exit trades quickly if the market goes against their initial prediction.Limitations of Price Action Trading
Risk Management When Trading Price Action
Price action traders must have risk management strategies in place to minimize potential losses. There are several ways to set up risk management in the financial market, as we discuss below.
Stop-Loss Orders
Stop-loss orders are placed at predetermined price levels. This is where traders decide to exit a trade if the market moves against their prediction. By placing a stop-loss order, you define how much capital you are willing to risk on a trade, thereby protecting your account from excessive losses.
Position Sizing
You must determine what size you are allocating to each position based on your risk tolerance. For instance, if you’re trading stocks, think in terms of share quantities. For forex, positions are entered based on lot sizes.
Considering the position size beforehand ensures that losses are kept within acceptable limits relative to your overall account balance.
Risk-Reward Ratio
Calculating the potential reward vs risk is crucial for every trade. For instance, you might opt for a risk-reward ratio of 1:3. This means you’re willing to risk $1 to make $3. This ratio helps you decide if a trade is worth the risk depending on the expected profit and potential loss.
Examples of Price Action Trading
This section explores some real-world examples of price action trading.
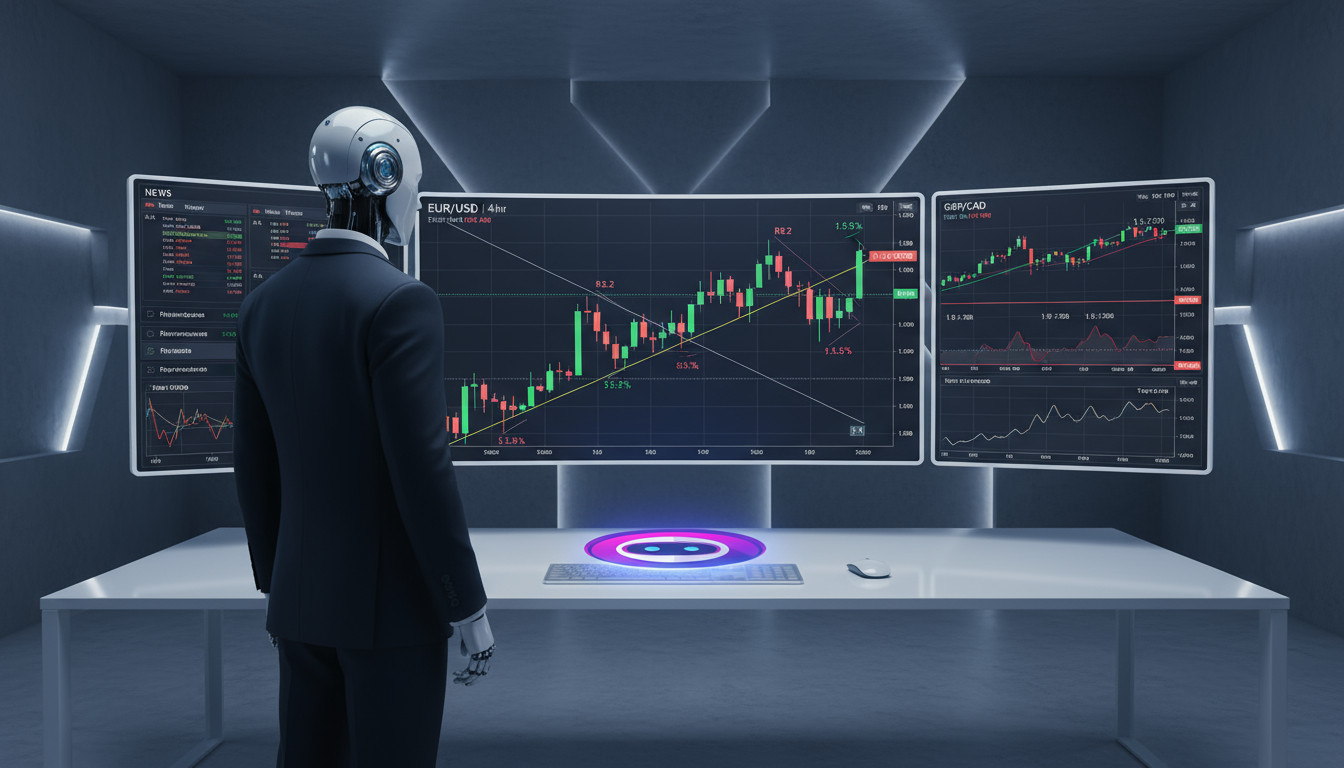
Price Action in Forex Trading
Let’s say you’re trading the forex pair EUR/USD.
- You notice that EUR/USD has been trading in a range between 1.0600 and 1.0800 over the past few days.
- This range has served as the support and resistance levels multiple times during this time frame.
- When the market opens, as the price approaches the support level at 1.0600, you look for confirmation with an indicator.
- For instance, you could look for a hammer candlestick to appear or for the RSI to go below 30, which could signal a trend reversal.
- Based on this data, you choose to enter a long position at 1.0610.
- Along with the trigger price, you should also set the take-profit and stop-loss levels.
- For the take-profit level, you might aim for the upper end of the range near 1.0800.
- For the stop-loss, you can set a range below the support level – at 1.05800.
Once the buy action is executed, you monitor how the market goes. Depending on the price action, you can modify your take-profit or stop-loss levels accordingly. For instance, if the price breaks the resistance level with good momentum, you can consider adjusting the take profit to a higher level.
Price Action in the Stock Market
Now let’s look into how price action trading works for a stock affected by economic indicators.
At the beginning of April 2024, a single Tesla stock was priced at around $170. However, Tesla faced significant challenges due to economic factors. For instance, the company’s Q1 earnings plunged by 48%, falling short of Wall Street predictions. Additionally, Tesla announced layoffs, further dampening market sentiment.
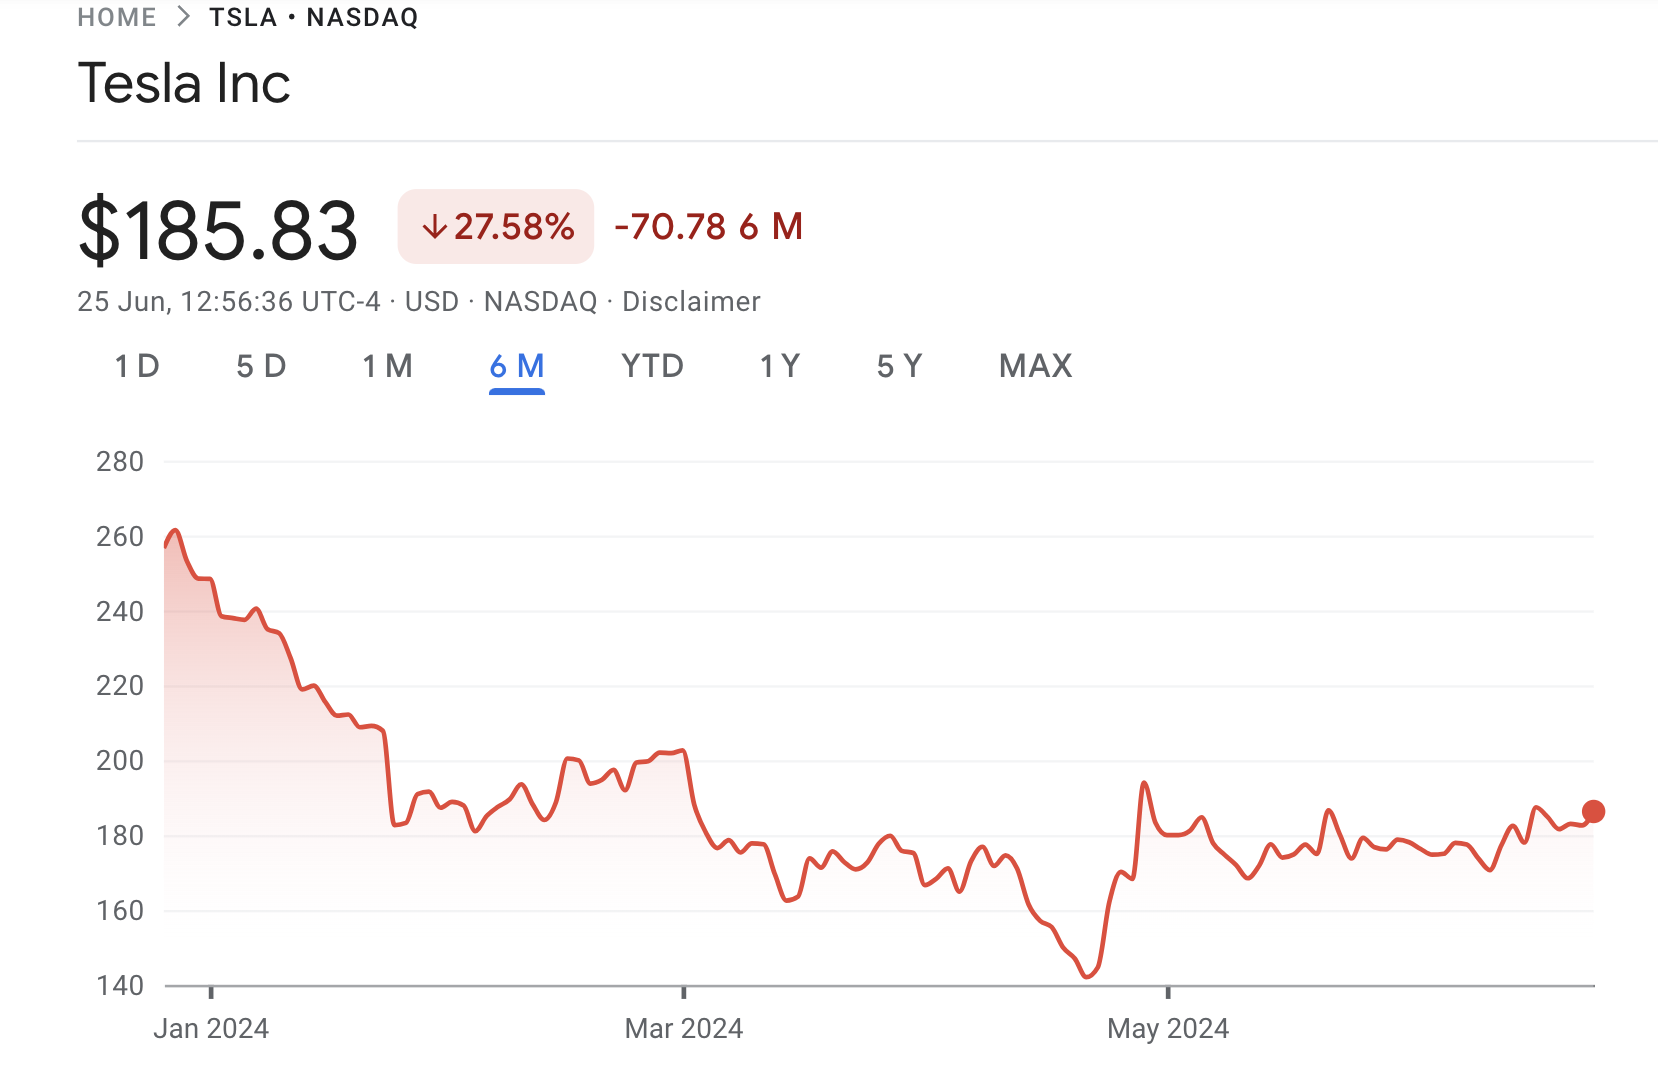
These events significantly influenced the market sentiment. Between April 11-23, Tesla’s stock price fell by 17%. Based on historical data, the value of a stock often tends to fall when such negative economic events occur. Seasoned traders capitalized by opening short positions on the stock.
From the above examples, it’s evident that price action trading requires you to be well-versed in both fundamental and technical analysis. By understanding how external factors affect an asset, you can predict the potential direction of the market.
Final Thoughts on Price Action Trading
In summary, price action trading is often used for its simplicity and effectiveness. For this reason, it’s suitable for new and seasoned traders alike. Although price action trading is a solid strategy, traders should proceed with caution.
Its success hinges on a trader’s ability to interpret price movements and patterns accurately. Put otherwise, price action is typically subjective, meaning two different traders might view pricing charts differently.
FAQs
What is price action trading?
Price action trading involves analyzing the price of an asset. Price action traders use candlestick and chart patterns to predict the future trend of the market.
Is it profitable to trade price action?
Price action trading can be profitable. However, it requires traders to interpret market dynamics to make trading decisions effectively. You must identify key trends and patterns using historical data and indicators. Ultimately, profitability from price action trading depends on individual strategy and risk management.
Do professional traders use price action?
Yes, many professional traders rely on price action to make their trading decisions. Typically, experienced traders use a combination of technical indicators and price action strategies to confirm their analysis.
Which indicator is best for price action?
Some of the most widely used technical indicators for price action include RSI, Bollinger Bands, and the Fibonacci Retracement. Traders also use charts and candlestick patterns to develop strategies for trading price action.
What are some of the common price action trading strategies?
Popular price action trading strategies include trend following, support and resistance levels, candlestick patterns (like hammer, doji, and engulfing patterns), and chart patterns.