AlgoBot MAD (Moving Average Deviation) is a precision tool designed to detect extreme price deviations from a moving average baseline. It helps traders identify potential mean-reversion opportunities and momentum extremes by visualizing deviation bands and highlighting pivotal price behavior. The indicator supports multiple deviation and band calculation modes, integrates pivotal candle logic for signal filtering, and includes a flexible alert system—all within a highly customizable visual interface.
Key Features
Multi-Type Moving Average Baseline
Choose from EMA, SMA, WMA, or HMA as the base for deviation calculations. This flexibility allows you to align the indicator with your trading strategy—whether you follow smoother trends or responsive short-term moves.

Adaptive Deviation Calculation
Configure the deviation display in absolute values or as a percentage of the price. This feature ensures that the indicator scales accurately for different asset classes, from low-priced stocks to high-volatility crypto pairs.

Dual Band Modes: Percentile or Standard Deviation
Select between the Percentile or Standard Deviation methods to define the outer bands. Percentile bands adapt to price distributions, while STDEV bands reflect statistical volatility over time. No rule says one is better than the other. They work differently, and it is hard to compare. Choose the one that you prefer.

Pivotal Candle Filtering
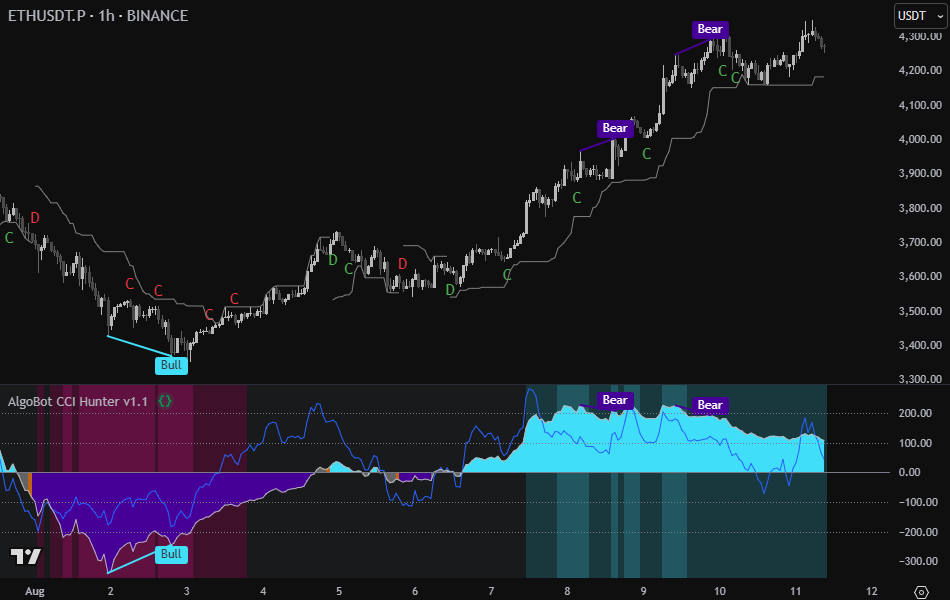
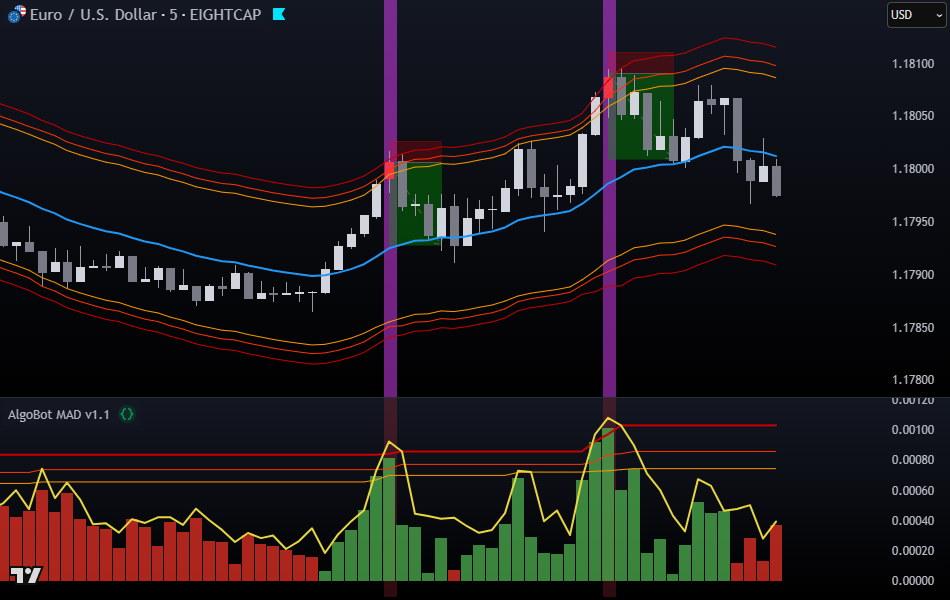
Enable optional filtering based on pivotal candle behavior to improve signal precision. Sensitivity levels can be adjusted, and only signals supported by recent price action are allowed to pass, reducing noise and enhancing relevance. Pivotal Candles are optimally colored on the main chart. They are also marked as dimmed vertical red and green bars in the indicator window.

Visual Bands on Main Chart
Overlay key deviation bands directly on the price chart for intuitive identification of stretched market conditions. These serve as dynamic zones for potential reversals or trend continuations.

Customizable Alert System
Receive alerts when price deviation exceeds a defined band or value threshold. Alerts can be configured using Band or Value trigger modes, and messages support rich placeholders, including ticker, direction, and price. The complete list is available in the settings tooltip.

Signal Marking on Chart
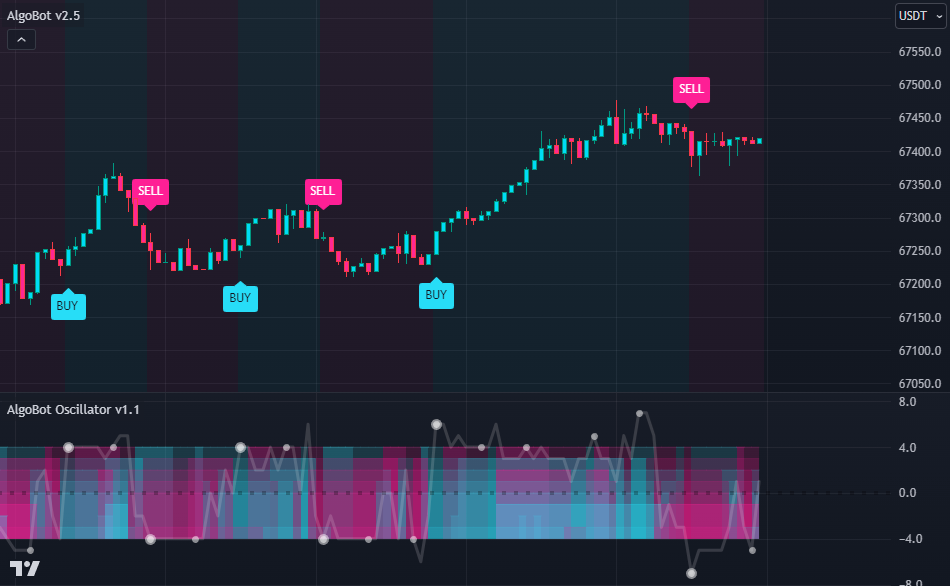
Enable visual markings for BUY and SELL signals, shown directly on the chart with color-coded backgrounds. This helps reinforce alert triggers with clear visual cues.

AlgoBot MAD Key Features Summary
- Supports multiple moving average types (EMA, SMA, WMA, HMA)
- Displays deviation as absolute value or percentage of price
- Offers Percentile and Standard Deviation band modes
- Detects pivotal candles for optional signal filtering
- Shows customizable deviation bands directly on the main chart
- Sends alerts based on Band or Value trigger logic.
- Marks BUY/SELL signals visually on the chart
- Suitable for mean-reversion, breakout, and volatility strategies