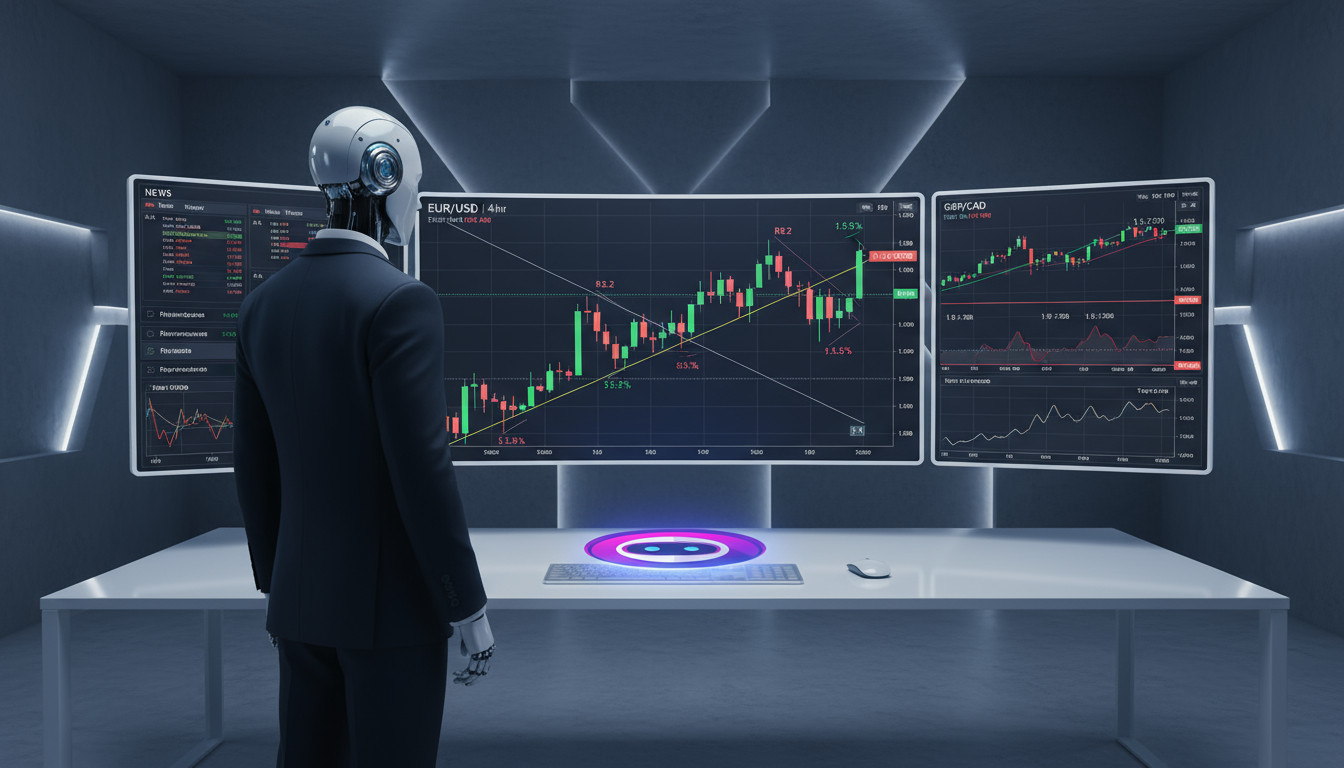
Time and sales data is often associated with fast-paced day trading, where traders analyze real-time transactions to make quick decisions. But is time and sales used only for day trading? While day traders rely on this data for precision and speed, algorithmic crypto traders can also leverage it to optimize their strategies. In this article, we’ll explore how time and sales data functions, its applications beyond day trading, and how it enhances algorithmic trading models.
Understanding Time and Sales in Trading
Time and sales data provides a detailed record of trading activity for a particular security or market. From a historical perspective, time and sales is similar to reading an old stock ticker tape. Today, it’s disseminated as a real-time digital display. Time and sales, or T&S, shows volume, price, direction, date, and time data for each trade that is executed on an exchange.
What Is Time and Sales Data?
Time and sales, also known as the trade tape, provides a tick-by-tick record of executed transactions. It details the price, volume, and time of each trade, offering deep insights into market activity. Time and sales data represents the heartbeat of the market, providing a window into the real-time actions of buyers and sellers. This data helps traders assess whether the market is being driven by large institutional orders or smaller retail trades, giving clues about future price movements. By studying these transactions, traders can gauge the strength of a trend and decide whether to join, hold, or exit their position.
Key Components of Time and Sales
Four things make up time and sales data: date and time, direction, price, and volume.
- Price – The transaction price at which a trade was executed.
- Volume – The number of assets bought or sold in a single transaction.
- Order Size – The amount of crypto traded in a single execution.
- Buy vs. Sell Classification – Whether the trade occurred at the bid or ask price. The rows of data are often color-coded in order to indicate whether the trade occurred on, in, or outside the bid or ask.
How Traders Interpret Time and Sales
Investors follow a number of different strategies and tools when deciding which stocks to buy and sell. Those using fundamental analysis attempt to determine the intrinsic value of a company by examining their financials, while investors using technical analysis attempt to forecast prices by plugging price movements and trading volume into statistical models. One technical analysis technique used by investors involves analyzing time and sales data.
- Spotting Momentum Shifts – Large orders can indicate market direction changes.
- Identifying Institutional Orders – Recognizing high-volume trades reveals the presence of major players.
- Confirming Breakouts and Trend Reversals – Analyzing trade sequences helps validate price movements.
Is Time and Sales Used Only for Day Trading?
Time and sales data are technical indicators showing live orders when trading, which is used to gauge the sentiment on a particular security. It tells you the volume, price, direction, date, and time. In other words, it’s an overview of the market, giving you recent highs and lows with the last traded price.
Why Day Traders Rely on Time and Sales
Day trading is a fast-paced form of investing in which individuals buy and sell securities within the same day. Day traders use time and sales to make split-second decisions. The ability to track transaction flow in real time helps them execute trades with precision, particularly in scalping and high-frequency trading (HFT). The main attribute of day trading is that the purchasing and selling of securities occurs within the same trading day. It means that all trading positions are liquidated at the end of a trading day. The main goals of day trading are discovering and leveraging short-term market inefficiencies.
Applications Beyond Day Trading
Time and sales can be used for any trading, such as day trading, swing trading, or long-term investing. However, day traders typically find it the most helpful because of its function.
- Swing Trading – Traders use it to confirm entry and exit points over days or weeks.
- Algorithmic Trading – Bots analyze time and sales to optimize order execution and detect liquidity patterns.
- Market Depth Analysis – Identifies hidden liquidity and iceberg orders.
Algorithmic Crypto Trading and Time and Sales
Algorithmic trading involves the use of computer programs to automatically execute trades based on a pre-defined set of instructions. These algorithms can analyze various data points, including price, volume, and time, to identify trading opportunities and execute trades accordingly.
How Algorithmic Traders Utilize Time and Sales Data
- Predictive Modeling – Machine learning algorithms analyze order flow trends.
- Market-Making Strategies – Bots leverage trade tape data to adjust bid-ask spreads.
- Arbitrage Opportunities – Time and sales data help identify price discrepancies across exchanges.
Integrating Time and Sales Into a Crypto Trading Bot
- Execution Strategies – Coding algorithms for optimal order placement.
- AI and Machine Learning – Identifying patterns in trade data to automate trading decisions.
Benefits and Risks of Using Time and Sales Data
Using time and sales data complements the use of charts and graphs for estimating share price movement. For example, bar charts and candlestick charts show trading ranges for a given period of time in aggregate and are used to see, for instance, handle, double bottom, and Hikkake patterns. This provides a broad view of price and volume trends. When coupled with the more granular trade information from time and sales, the investor can create a more detailed picture of a security’s trends.
Advantages for Algorithmic Traders
- Real-Time Data – Provides insights ahead of lagging indicators.
- Enhanced Execution Speed – Enables precise entry and exit points.
- Detection of Large Order Flow – Helps track institutional movements.
Risks and Limitations
- Overfitting – Bots may misinterpret historical data.
- Liquidity Concerns – Crypto markets can be thin, affecting data reliability.
- Market Manipulation – Spoofing and fake orders can distort readings.
Best Practices for Using Time and Sales in Algo Trading
Many trading platforms today allow investors to customize the display of time and sales data, for example, by adding volume or price filters. Investors using a time and sales data approach will likely have more success with stocks that have strong volume.
Combining Time and Sales with Other Data
- Order Book Analysis – Provides context to executed trades.
- Volume Profile Indicators – Helps confirm strong price levels.
Avoiding Common Pitfalls
- Filtering Out Noise – Adjusting algorithms to ignore misleading price spikes.
- Latency Considerations – Ensuring data processing is fast enough for timely execution.
Conclusion
Time and sales data is a powerful tool beyond just day trading. Algorithmic crypto traders can harness it for predictive modeling, market-making strategies, and high-frequency trading. By understanding its benefits and limitations, traders can develop robust trading strategies that maximize efficiency and minimize risk.
FAQs
- What is the difference between time and sales and level 2 market data?
Time and sales show executed trades, while level 2 displays open orders and market depth. - Can time and sales be used for long-term investing?
While more relevant for short-term traders, long-term investors can use it to confirm accumulation trends. - How do algorithmic traders filter out fake orders in time and sales?
Advanced bots use machine learning to detect and ignore spoofing patterns. - What role does time and sales play in high-frequency trading?
HFT firms rely on it for millisecond-level trade execution and arbitrage strategies. - Are there any crypto exchanges that provide real-time time and sales data?
Yes, exchanges like Binance, Coinbase Pro, and Kraken offer real-time trade tape data.