Trading indicators are pivotal for navigating the forex market. These tools provide critical insights into market trends and possible price movements.
That being said, it’s difficult to choose and apply the right technical indicators as a beginner.
This guide explores the most useful forex indicators for traders. We delve into their functionalities and offer practical tips on using them to optimize your trades.
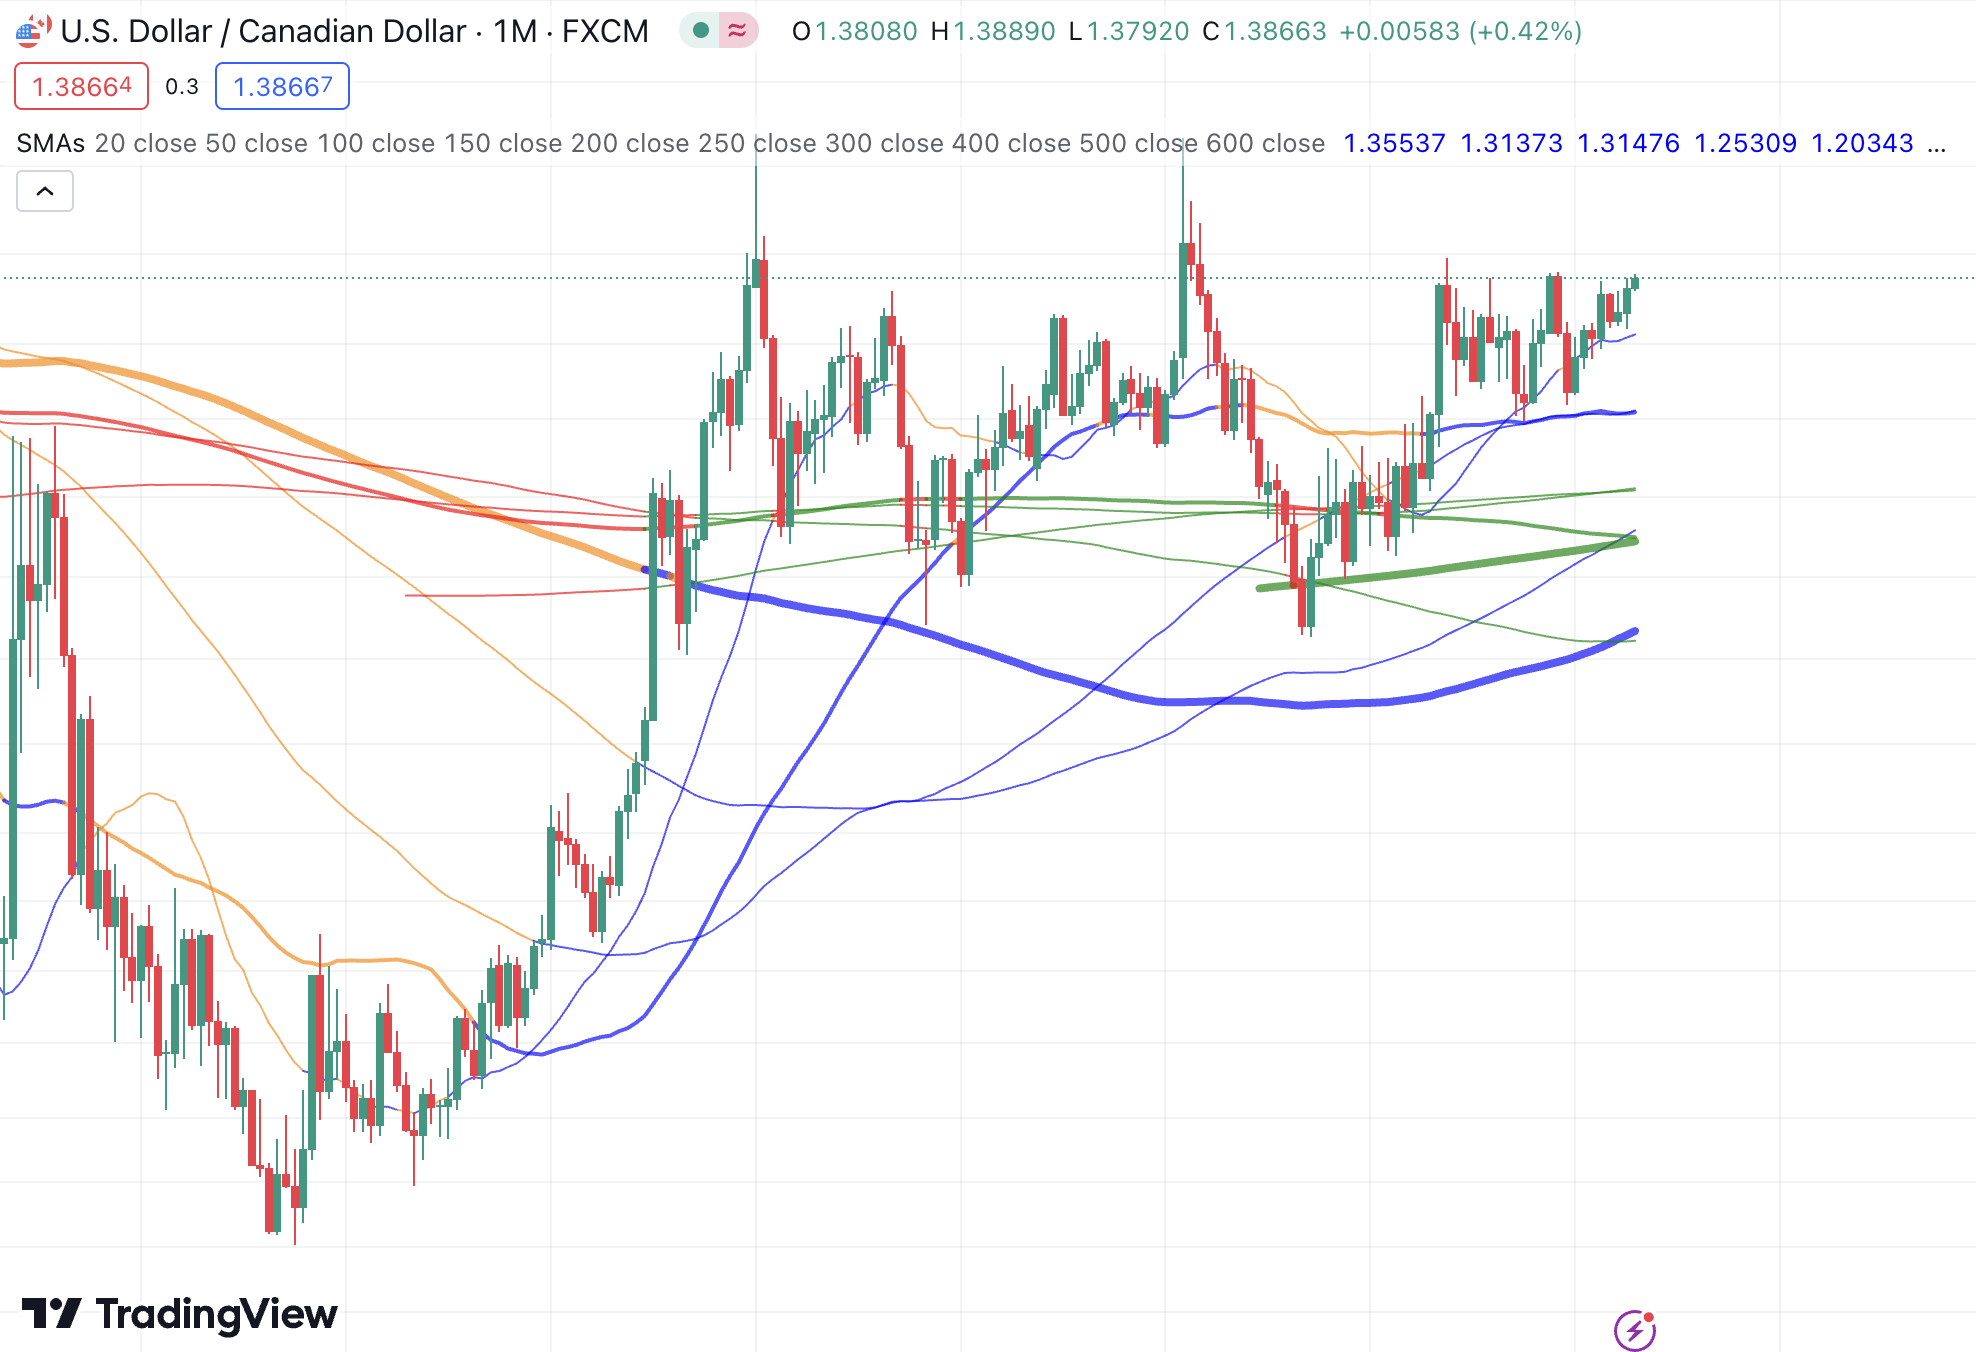
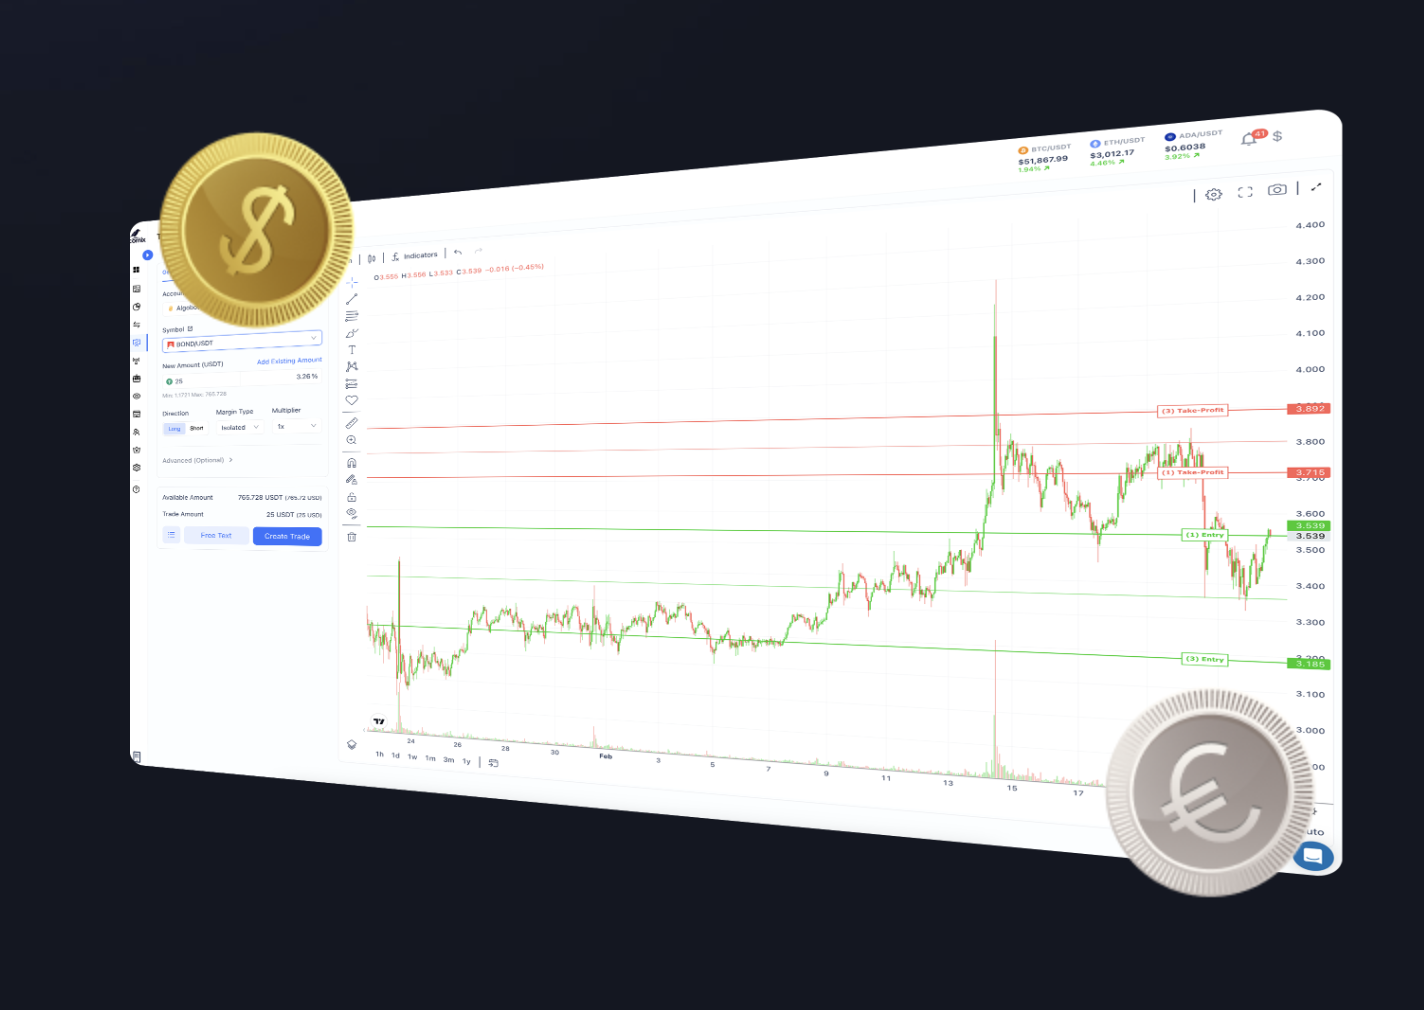
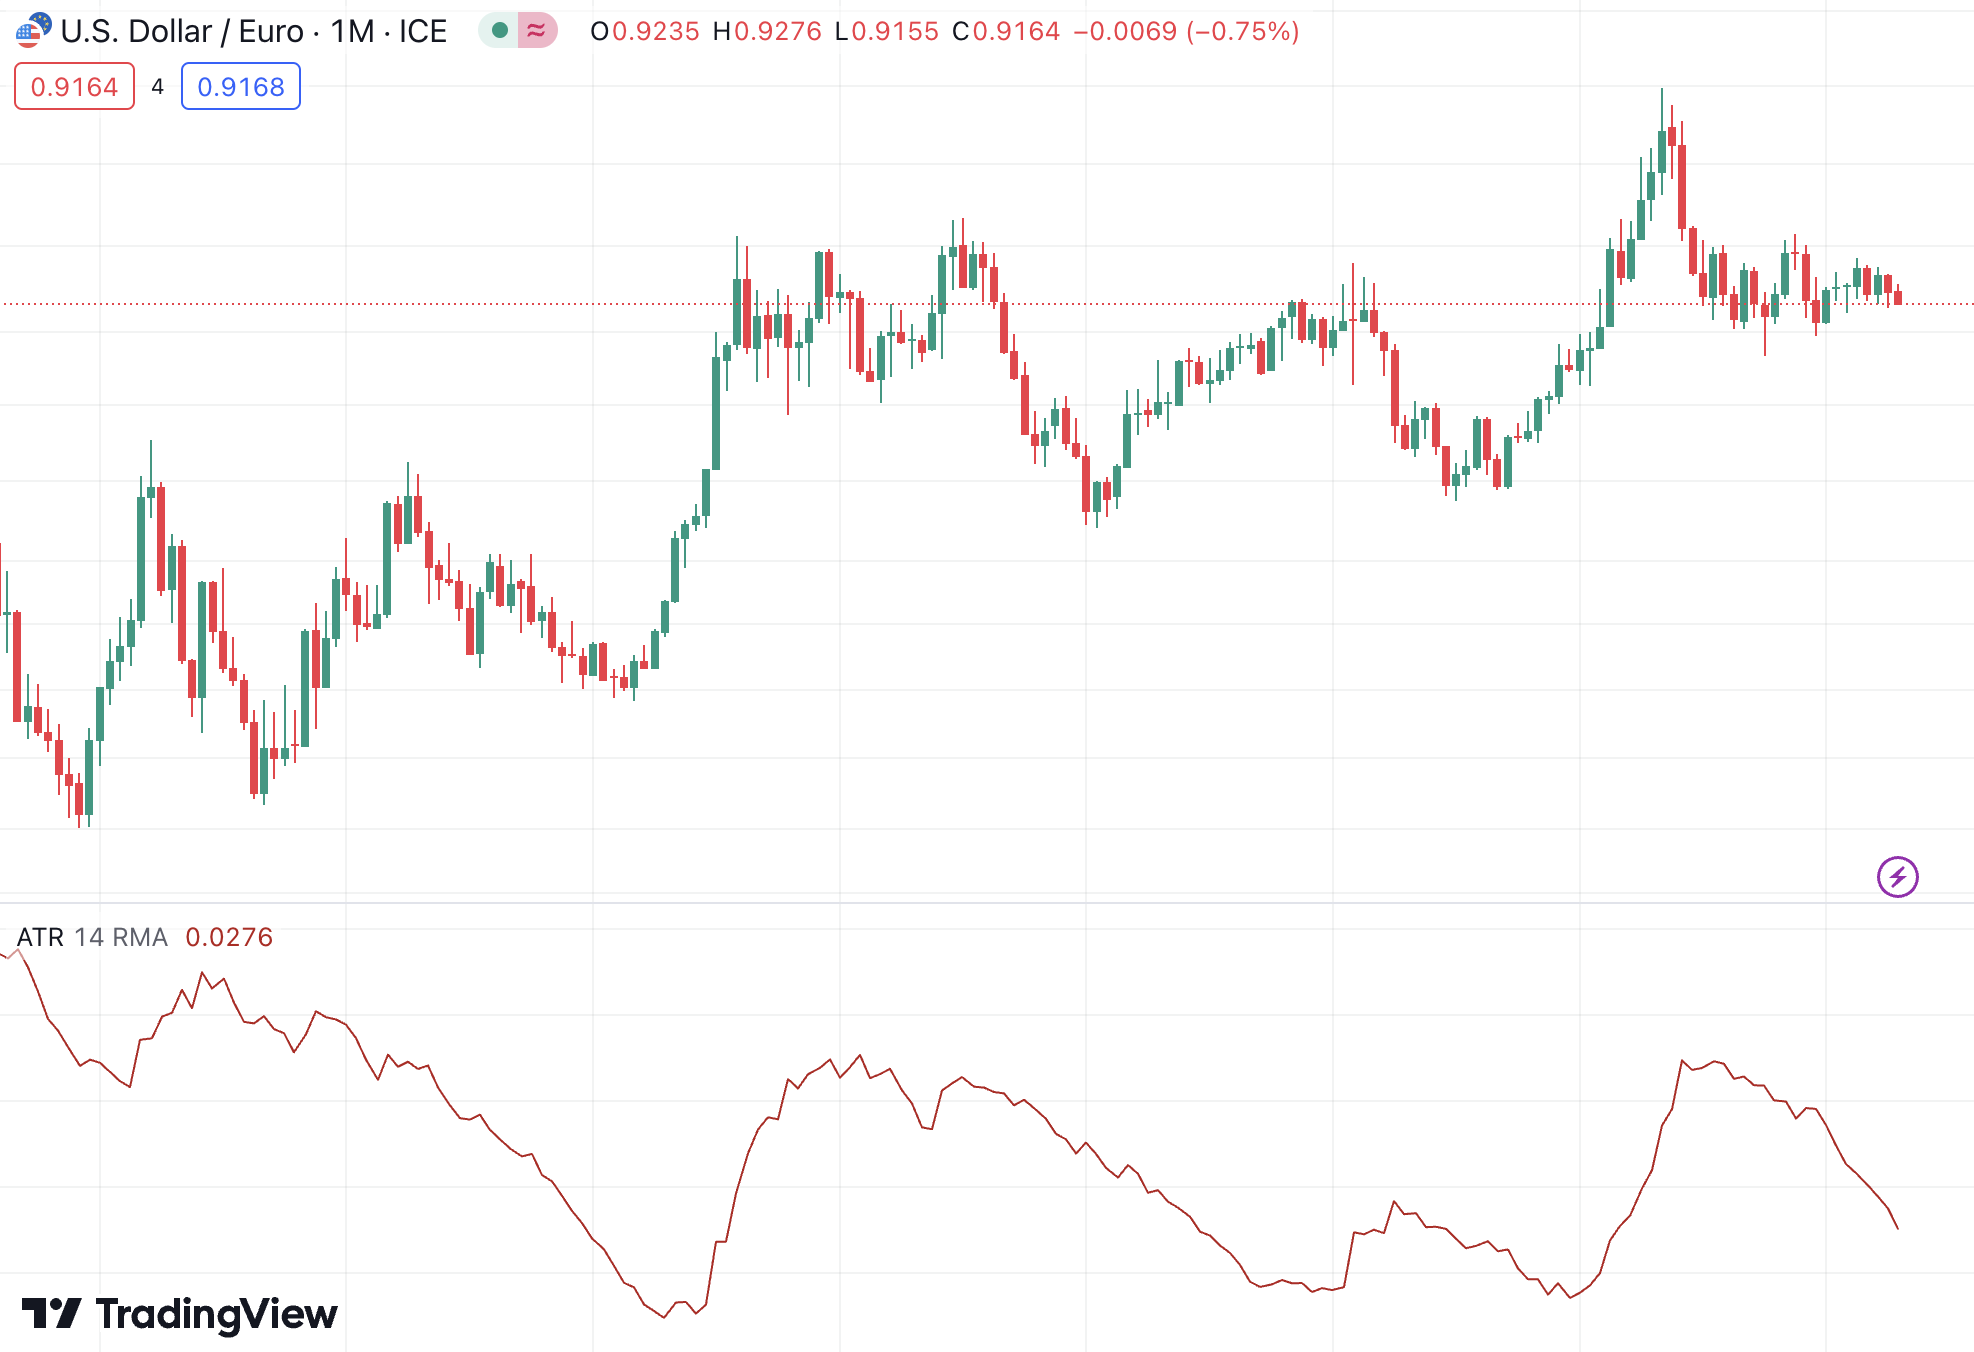
Here are the key takeaways you need to know about forex trading indicators: In simple terms, trading indicators are mathematical calculations that help analyze an asset’s price action. These tools take data from the historical price of the chosen forex pair. Technical indicators are valuable in determining potential trading signals, market trends, and momentum shifts. You’ll find virtually hundreds of forex indicators in today’s market. These indicators can offer unique insights into market patterns. While some focus on identifying trends, others highlight overbought or oversold conditions, measure market volatility, or analyze trading volume. Technical indicators also vary widely in terms of complexity. Crucially, no forex indicator can definitively predict the market’s next move with complete accuracy. However, you can use multiple indicators together with other analysis methods. This will help you obtain a better overview of the forex market. Forex indicators analyze statistical trends from price action. The results are plotted on charts of the respective forex pair. This provides visual representations of market trends, momentum, and potential turning points. In a nutshell, the top forex indicators help traders do the following: Put simply, forex indicators are designed to assess short-term price movements. As such, they are primarily used by active traders. Moreover, due to their quantitative nature, indicators are also incorporated into forex trading bots. As mentioned, the best forex indicators focus on different aspects of market data. Here’s a quick overview of each indicator category: Trading indicators can also be leading or lagging. A leading forex indicator predicts upcoming price trends, such as the Relative Strength Index and the Stochastic Oscillator. On the other hand, lagging indicators give an overview of historical price action and confirm a trend. Examples include Bollinger Bands and Moving Averages. Traders can deploy both forex indicator types for the most effective results. Forex indicators offer several advantages, making them indispensable tools for both novice and experienced traders. Below, we explore the key benefits of top forex indicators. Forex indicators are all about data-driven insights. These tools rely on historical price data and take an analytical approach. This reduces reliance on guesswork and emotional biases. When used effectively, the top forex indicators can help define trends and possible entry and exit points. Moreover, integrating multiple indicators into a trading strategy allows for cross-verification of signals. This further enhances the accuracy of trade decisions. In other words, forex indicators foster a systematic trading strategy. Forex indicators also save traders valuable time. Instead of manually analyzing charts and price movements, traders can use indicators to make decisions quickly. For instance, indicators like the Stochastic Oscillator or MACD provide real-time signals about market momentum and trend reversals. In other words, indicators allow traders to act swiftly. This ‘time efficiency’ is especially beneficial in the fast-paced forex market, which alters rapidly. By relying on indicators, traders can dedicate more time to other important tasks – such as developing strategies. Another notable advantage of forex indicators is that they’re adaptable. You can find indicators that work across various market parameters and trading styles. Whether the market is trending, going sideways, or experiencing high volatility, there are indicators designed to provide relevant insights. For example: Traders simply need to select the appropriate indicator for the respective market condition. Another significant benefit of using forex indicators is their contribution to effective risk management. For instance, the ATR provides insight into market volatility. This allows traders to set appropriate stop-loss distances that account for normal price fluctuations. By using multiple indicators, traders can better handle their risk exposure. This ensures that potential losses are controlled within acceptable limits. This disciplined approach to risk management is paramount for succeeding in the forex market. There are virtually hundreds of forex indicators available today. Below, we discuss the most popular forex indicators used by traders. Moving Average, or MA, is one of the most commonly used trend indicators. It smooths out the small price fluctuations to identify the trend direction. The main concept is to average out a currency pair’s price over a specific period to observe its trend cycle. Several types of Moving Averages are available. But the Simple Moving Average (SMA) and Exponential Moving Average (EMA) are the most popular. Forex traders can calculate Moving Averages for different time periods based on their strategy. For example, a 10-day MA uses the price action of the previous 10 days. The time frame can vary from 5-day to 200-day in MA indicators. The Average True Range (ATR) is an indicator of market volatility. It calculates the average range of price movements over a specific period, typically 14 days. The ATR helps traders understand the degree of market volatility and is also used to set trade parameters, such as stop-loss levels and capital sizing. The ATR indicator is also often used to set dynamic stop-loss levels. Traders typically set stop-loss orders at a multiple of the ATR value from the entry price. For example, if the ATR is 100 pips, the stop-loss order could be 1.5 x 100 (150 pips) from the entry price. Bollinger Bands alert you when the price of a currency pair moves outside its typical trading range. This indicates whether the forex pair is overbought or oversold. This tool consists of three lines. First, there is a middle band, which is a Simple Moving Average, usually set to 20 periods. Next, two outer lines deviate from the middle band. However, when the price engages with the Bollinger Band, it could represent a ‘fleeting moment’. It’s best to wait until a full candle is formed outside the upper or lower band to confirm a potential trend reversal. Additionally, it’s best to use Bollinger Bands with other technical indicators for confirmation. Fibonacci Retracements are used to determine the support and resistance levels of a forex pair. These levels are derived from the Fibonacci sequence. The most commonly used retracement levels are 23.6%, 38.2%, 50%, 61.8%, and 78.6%. The Fibonacci levels can be drawn on the chart by identifying the lowest and highest points of a trend. The indicator will then identify potential areas where the price could encounter support or resistance. The Relative Strength Index, or RSI, gauges the momentum strength of a forex pair. The indicator ranges between 0 and 100. This indicator has multiple use cases: Overall, the RSI can help set entry and exit points to fine-tune stop-loss and take-profit levels. This indicator identifies changes in the momentum of a forex pair by comparing two moving averages. It has two lines – MACD and signal. The position of the crossover relative to the 0 is critical. These signals can indicate buy and sell opportunities, respectively. The Elliott Wave Forex Theory is another technical indicator used by day traders for charting trends. The theory proposes that the market moves in repetitive cycles influenced by trader psychology. It classifies price action into two – impulse and corrective waves: Forex traders can use these waves to pick entry, exit, and stop-loss levels. The Ichimoku Cloud provides a summary of market trends. It supplies a snapshot of momentum and probable support and resistance levels. It has five different components – represented by clouds (shaded areas) and colored lines (red, blue, and green). Put simply, analyses are made based on the cloud’s position. The Ichimoku cloud can be used to identify trends as follows: When represented on a chart, the Ichimoku Cloud can be hard to interpret. For this reason, this indicator is often used by experienced traders. While the top forex indicators can be useful, they also have certain limitations. To manage indicators and signals effectively, traders must understand their drawbacks. Ultimately, experience plays a key role in using forex indicators effectively. Moreover, forex indicators shouldn’t be the only tool in a trader’s arsenal. Analysis procedures should also include economic indicators, market news, and alternative data. To create an effective forex trading strategy, you need to know how to use and interpret different technical indicators. The required steps will depend on many factors, such as your overall trading plan. We’ll now discuss what you need to consider when merging top forex indicators with a profitable trading strategy. Every trader requires a well-thought-out plan. This provides a structured approach to trading by outlining goals and risk tolerance. Moreover, a trading plan will determine the best forex indicator for you. For example, if you’re a swing trader, you might choose indicators like Moving Averages and the Average True Range (ATR). On the other hand, if you’re a scalper, the trading plan should incorporate short-term indicators, such as the Stochastic Oscillator and Bollinger Bands. While a single indicator can provide valuable insights, combining multiple indicators often yields a more thorough view of market conditions. It’s best to choose indicators that work well with each other. Alternatively, you can also combine a trend indicator with a momentum tool, such as the Stochastic Oscillator. Since each indicator offers a unique perspective on market conditions, they can be used to confirm each other’s signals. Before committing to any indicator, it’s essential to test its effectiveness in different market conditions and time frames. This is when you can take advantage of paper trading platforms. They allow you to test your trading strategy in real market conditions without risking a cent By testing your chosen indicators in demo mode, you can discover their benefits and limitations. Based on the trading outcomes, you can adjust the indicator parameters or try different ones. For instance, changing the period length of a Moving Average can impact its responsiveness to price changes. While it can be smart to use multiple indicators, it’s important to avoid redundancy. This is a common mistake made by beginners. Simply put, using similar indicators can lead to confusion rather than clarity. The key is to select a combination of indicators that complement each other by providing different perspectives on market conditions. The forex market is dynamic. What works well in one market condition might not be as beneficial in another. Therefore, be prepared to adapt when selecting the best forex indicator. For a start, you should regularly review your indicators’ performance. You can then tweak your trading plan as needed. More importantly, you should stay informed about the latest indicators and trading techniques. New forex indicators and tools are launched every day. Learning about these tools will help you stay ahead of market trends and obtain a competitive edge. Active forex traders use charting platforms to analyze their chosen currency pair. As such, charts mustn’t clutter your decision-making abilities. When using multiple forex indicators, make sure they’re systematized and easy to comprehend. Most charting platforms facilitate a great degree of customization. To achieve clarity, you can adjust everything from the background color to the style of trading indicators. A clean and visually appealing chart will help you make the most of forex indicators. Undoubtedly, forex indicators are incredibly useful for traders. However, finding the right indicators and deploying them effectively can be challenging for a newbie. This is where an automated forex trading bot can assist. Ultimately, you don’t need to worry about picking the right indicators or timing your trades. In other words, Algobot trades independently – with no human input required whatsoever. Crucially, it trades major, minor, and exotic forex pairs. With a remarkable win rate of over 81%, Algobot makes forex trading effortless for beginners and professionals alike
Forex indicators are powerful tools that provide crucial insights into market trends. These tools help you assess price action and develop the most suitable trading strategy for the forex market. That said, it’s crucial to remember that trading indicators offer no guarantees. They simply offer ‘clues’ to potential market movements based on past data and statistical likelihoods. For this reason, technical indicators shouldn’t be solely relied upon. Instead, traders should aim to develop a comprehensive trading plan. Nonetheless, when paired with the right risk management strategy, indicators can enhance your forex trading strategy. Forex indicators read the market sentiment using mathematical tools. However, their reliability often depends on market conditions and should be used with other forms of analysis. The best indicator for forex trading depends on individual strategies and risk goals. Nonetheless, indicators such as Moving Averages, Bollinger Bands, and MACD are widely used by forex traders. You can use as many forex indicators as you want. However, it’s important to avoid redundancy and clutter when using multiple indicators collectively. There isn’t a single ‘most powerful’ indicator in trading. The effectiveness of each indicator varies depending on the forex market and individual strategies.Forex Indicators – Key Takeaways
What are Forex Trading Indicators?
How Forex Indicators Work?
Types of Forex Indicators
Advantages of The Best Forex Indicators
Enhance Decision Making
Time Efficiency
Use Across Different Market Conditions
Effective Risk Management
Best Forex Indicators for Successful Trading
Moving Average
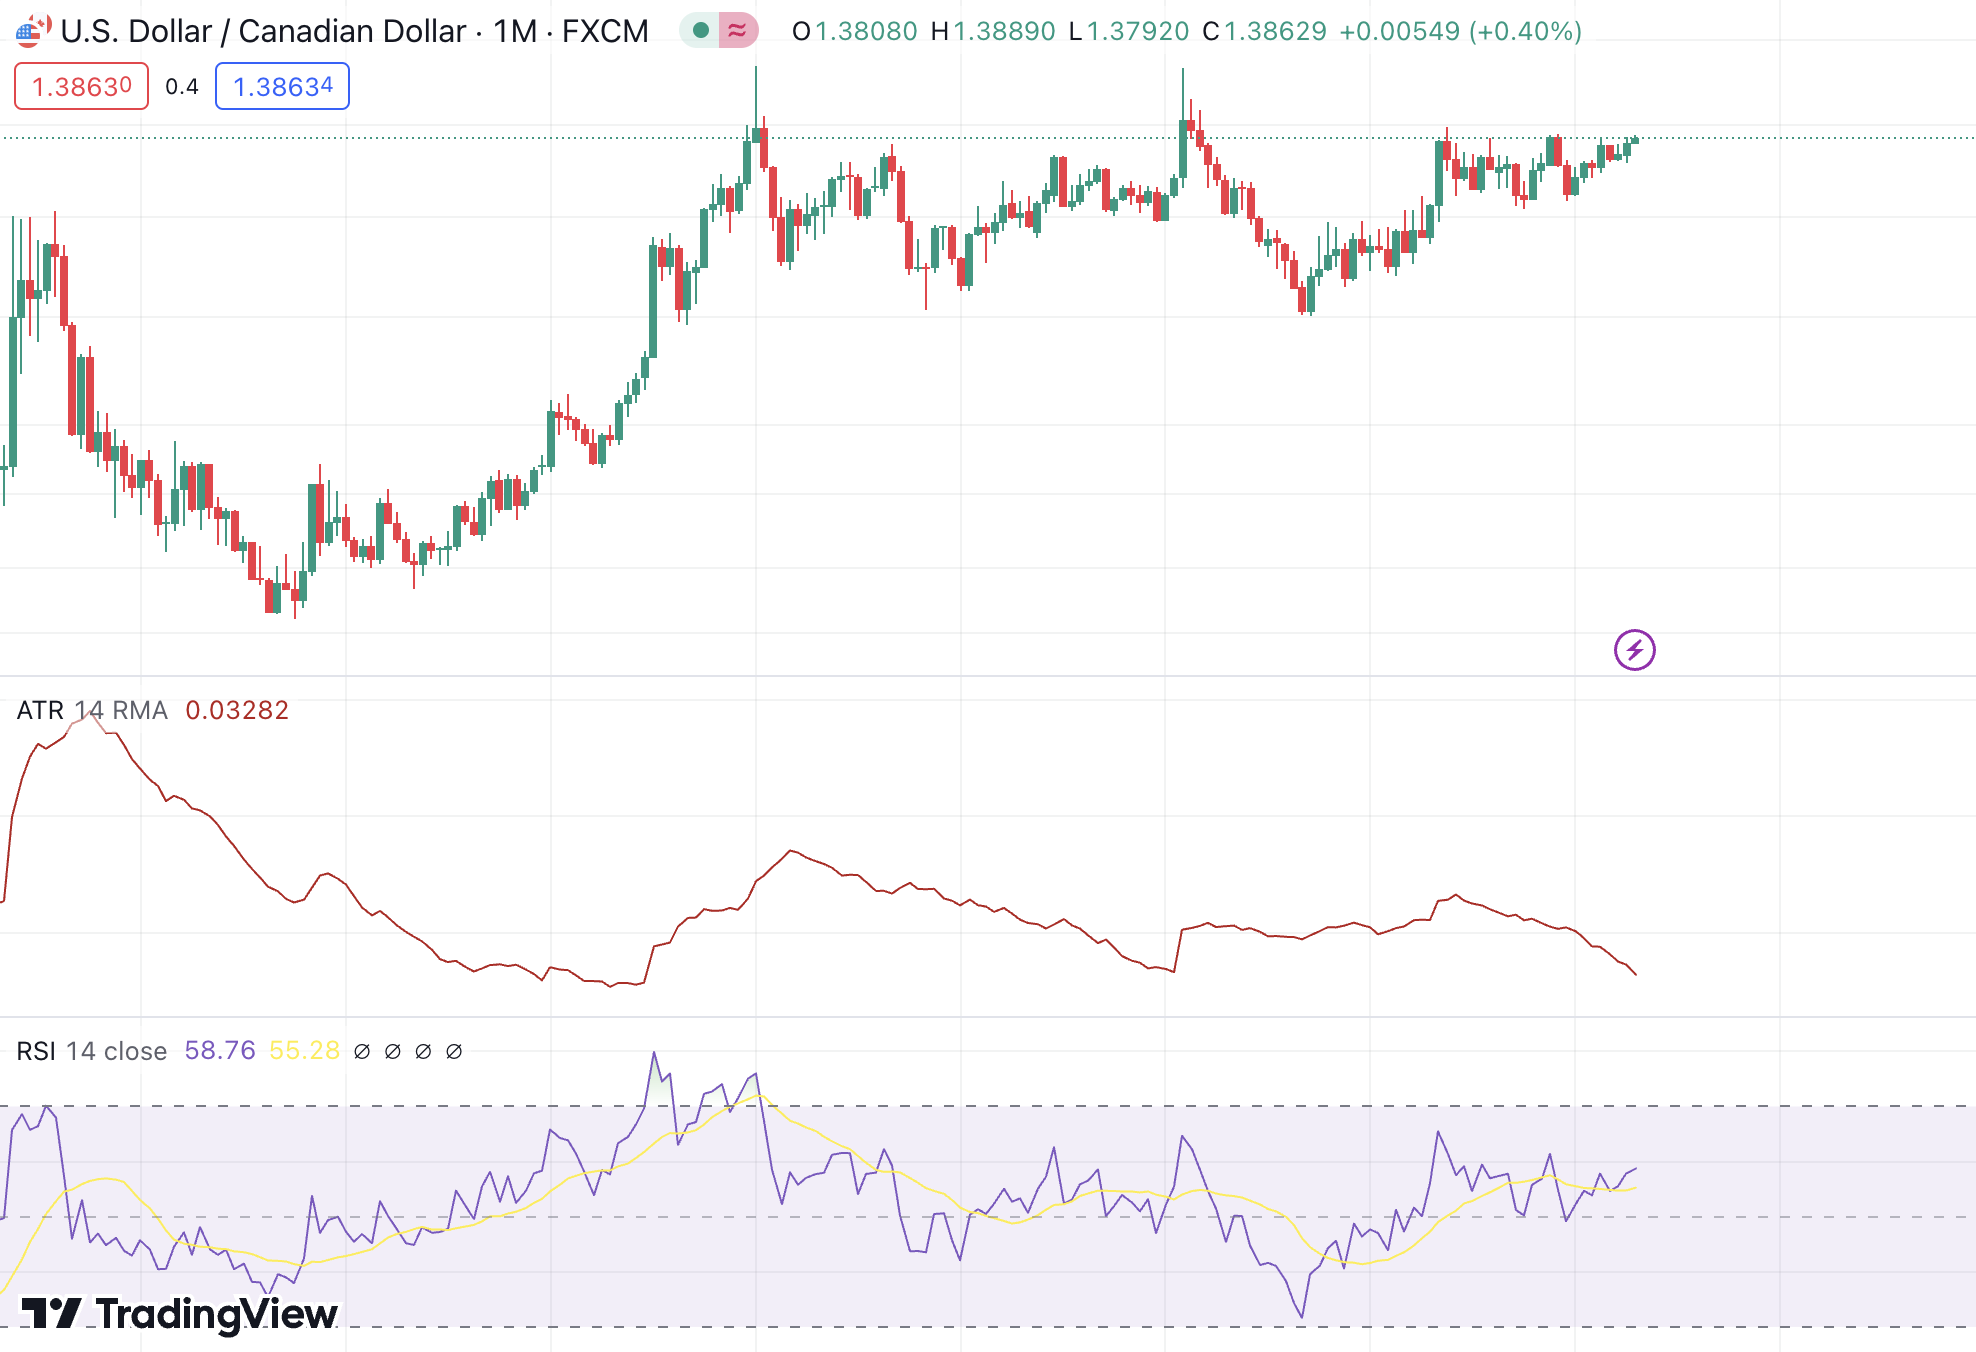
Average True Range
Bollinger Bands
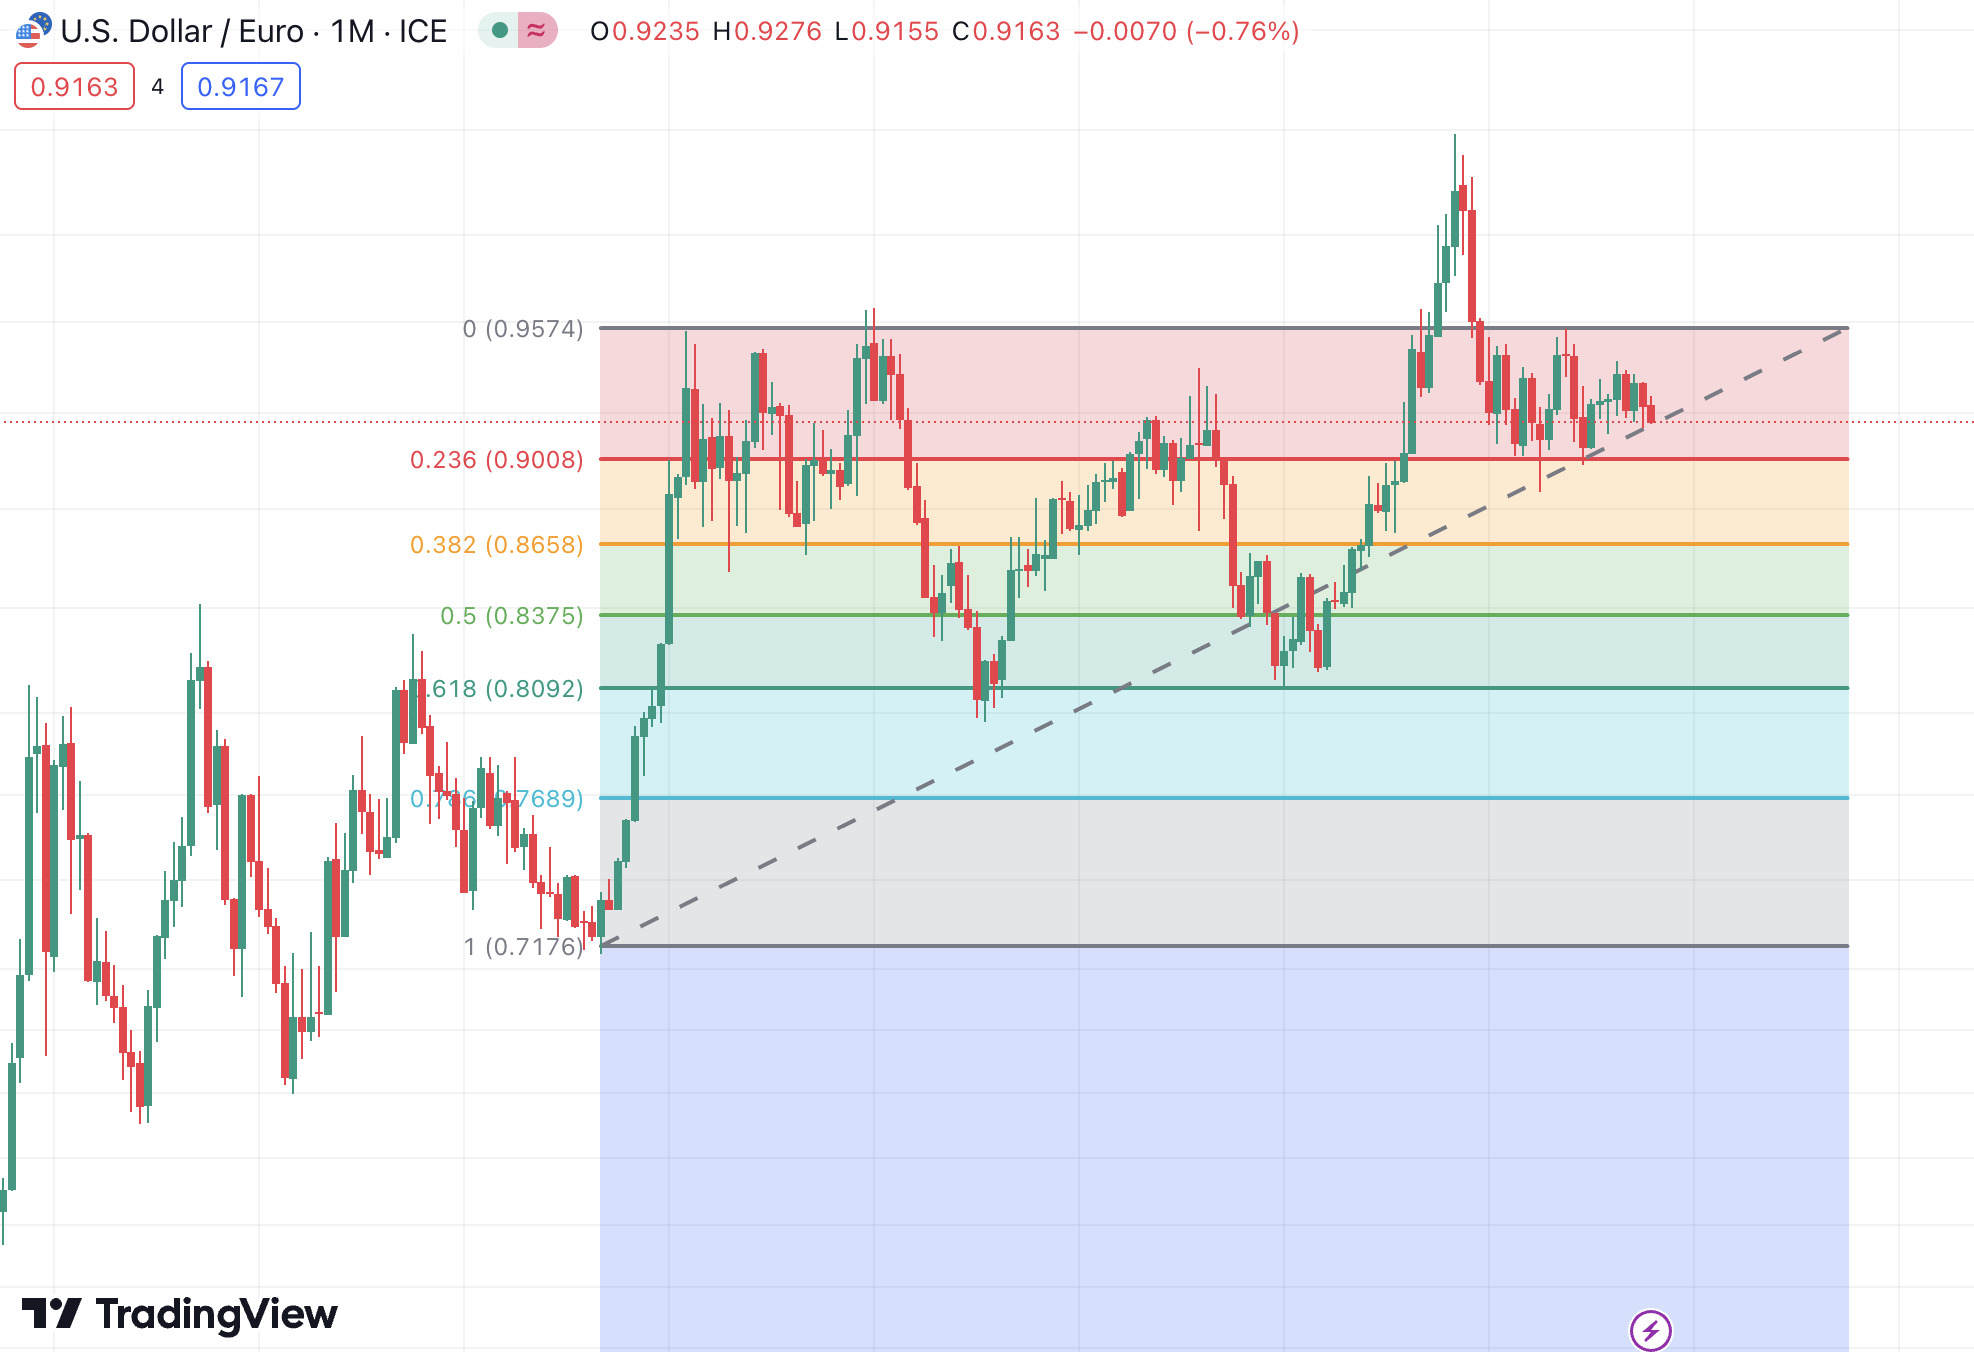
Fibonacci Retracements
Relative Strength Index
Moving Average Convergence Divergence
Elliott Wave Forex Theory
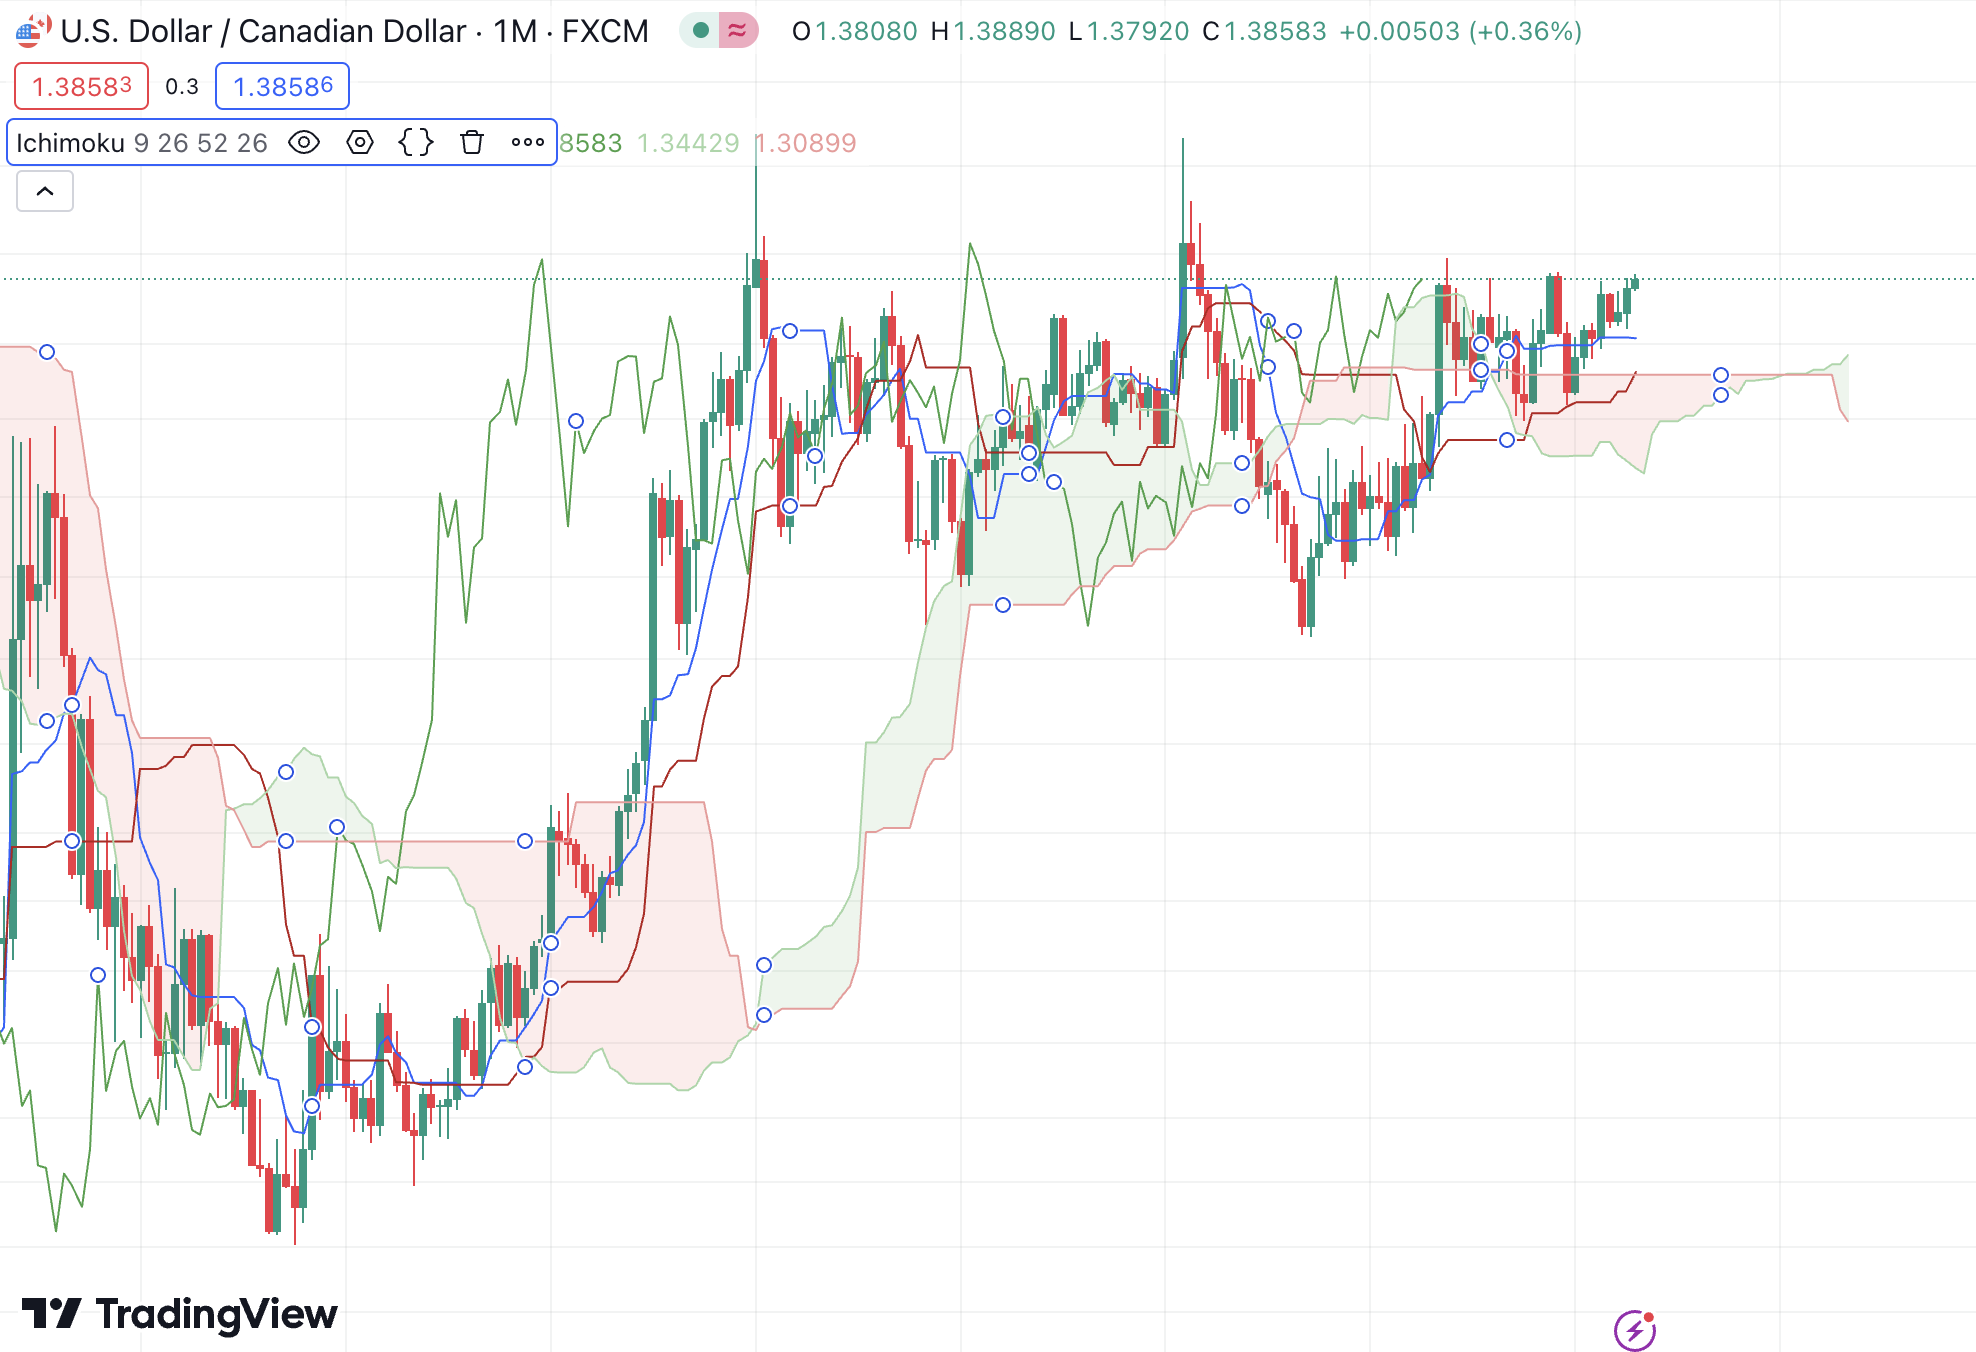
Ichimoku Cloud
Limitations of Forex Indicators
How to Integrate The Best Forex Indicator into Your Trading Strategy
Develop a Strategy
Combine Indicators
Test Indicators in Demo Mode
Avoid Redundancy
Stay Adaptable
Keep Trading Charts Clean
Best Way to Trade Forex Using Indicators
Conclusion
FAQs
Are forex indicators reliable?
Which is the best forex indicator?
How many forex indicators can I use?
Which is the most powerful forex indicator?