Bitcoin’s rising popularity has encouraged traders to create new tools for market analysis. One such instrument is the Bitcoin Rainbow Chart.
It’s a long-term valuation tool that forecasts Bitcoin’s future price direction.
In this guide, we take a closer look at the Bitcoin Rainbow Chart. We discuss how the chart works, its various use cases, and what benefits it offers to Bitcoin investors.
Here are the main points to know about the Bitcoin Rainbow Chart:Bitcoin Rainbow Charts – Key Takeaways
Bitcoin Rainbow Chart (BRC): An Overview
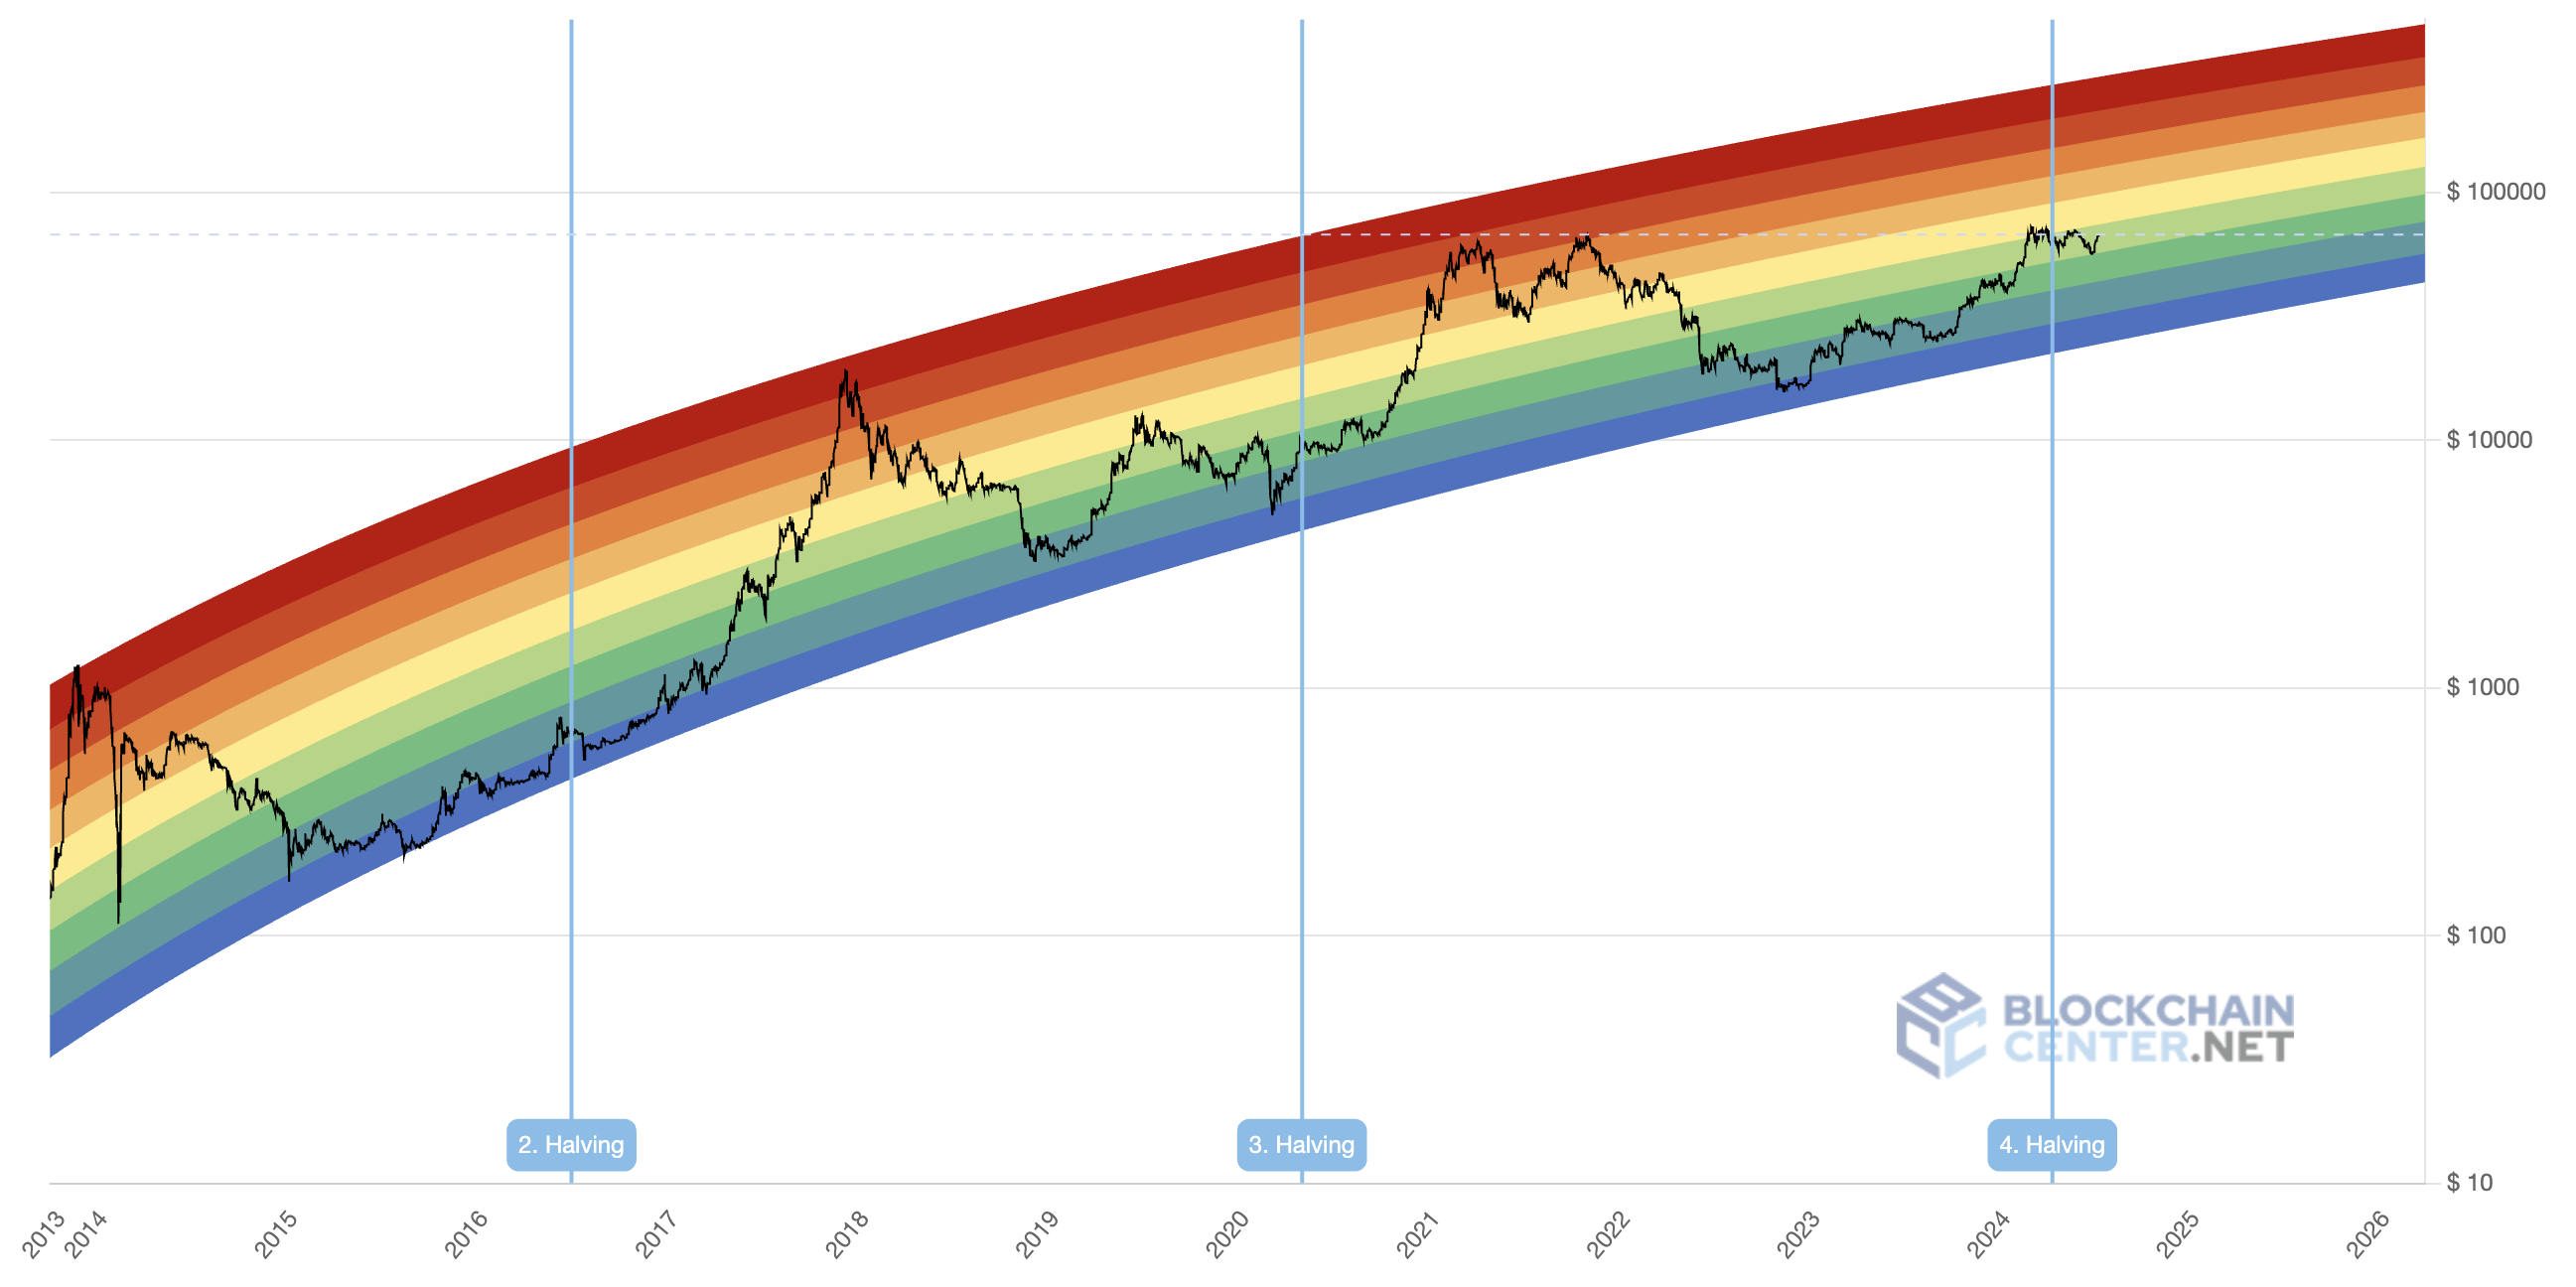
The Bitcoin Rainbow Chart is a long-term, logarithmic regression chart. In simple terms, the chart overlays the historical price movements of Bitcoin onto a logarithmic scale. It uses a rainbow-colored spectrum to categorize the price action of Bitcoin.
There are nine colors in the BRC. Each color band indicates a different layer of Bitcoin’s price cycle. The inference from the Bitcoin Rainbow Chart can be broadly classified as follows:
- The colder colors suggest a good time to buy Bitcoin.
- The warmer shades indicate it might be a good time to sell Bitcoin.
As mentioned, the BRC is built on historical price data. So, it has limitations. Nonetheless, it also considers Bitcoin Halving events, which take place every four years.
How was the Rainbow Chart Bitcoin Created?
The BRC has an interesting origin story. It was first developed by Reddit user ‘azop’ in 2014 as a joke. In its original version, the Bitcoin price was simply represented on a long scale with a rainbow-colored band.
Later, another user named ‘Trololo’ added logarithmic regression to the original chart. And the logarithmic scale managed to overlap on the rainbow arc. This led to the Bitcoin Rainbow Chart 2024 that we currently use. The official version of the chart is available on Blockchaicenter.net.
However, when the Bitcoin price fell below the rainbow arch, new colors, such as dark red, were added. While the BRC began as a meme, it has gained considerable attention. Today, you can even find many variations of this chart among prominent indicators on reputed platforms.
However, it’s essential to note that the chart is unreliable for precise price prediction. The color bands are not designed to reflect current market sentiments accurately. Rather, they provide a broad, historical context about the price trends of Bitcoin.
How the Bitcoin Rainbow Chart Works
Now that you have an overview of the Bitcoin Rainbow Chart, let’s take a deep dive into this indicator.
Logarithmic Regression
Logarithmic regression is the foundation of the Bitcoin Rainbow Chart. It’s a method for modeling data that starts strongly and then slows down over time. The result is a smooth curve that begins steep and then flattens out.
In the case of Bitcoin, logarithmic regression shows how its price has risen over time. Initially, Bitcoin’s value surged rapidly, reflecting the token’s early growth phases. Over the years, the rate of its price increase has slowed down, and the logarithmic curve depicts this shift.
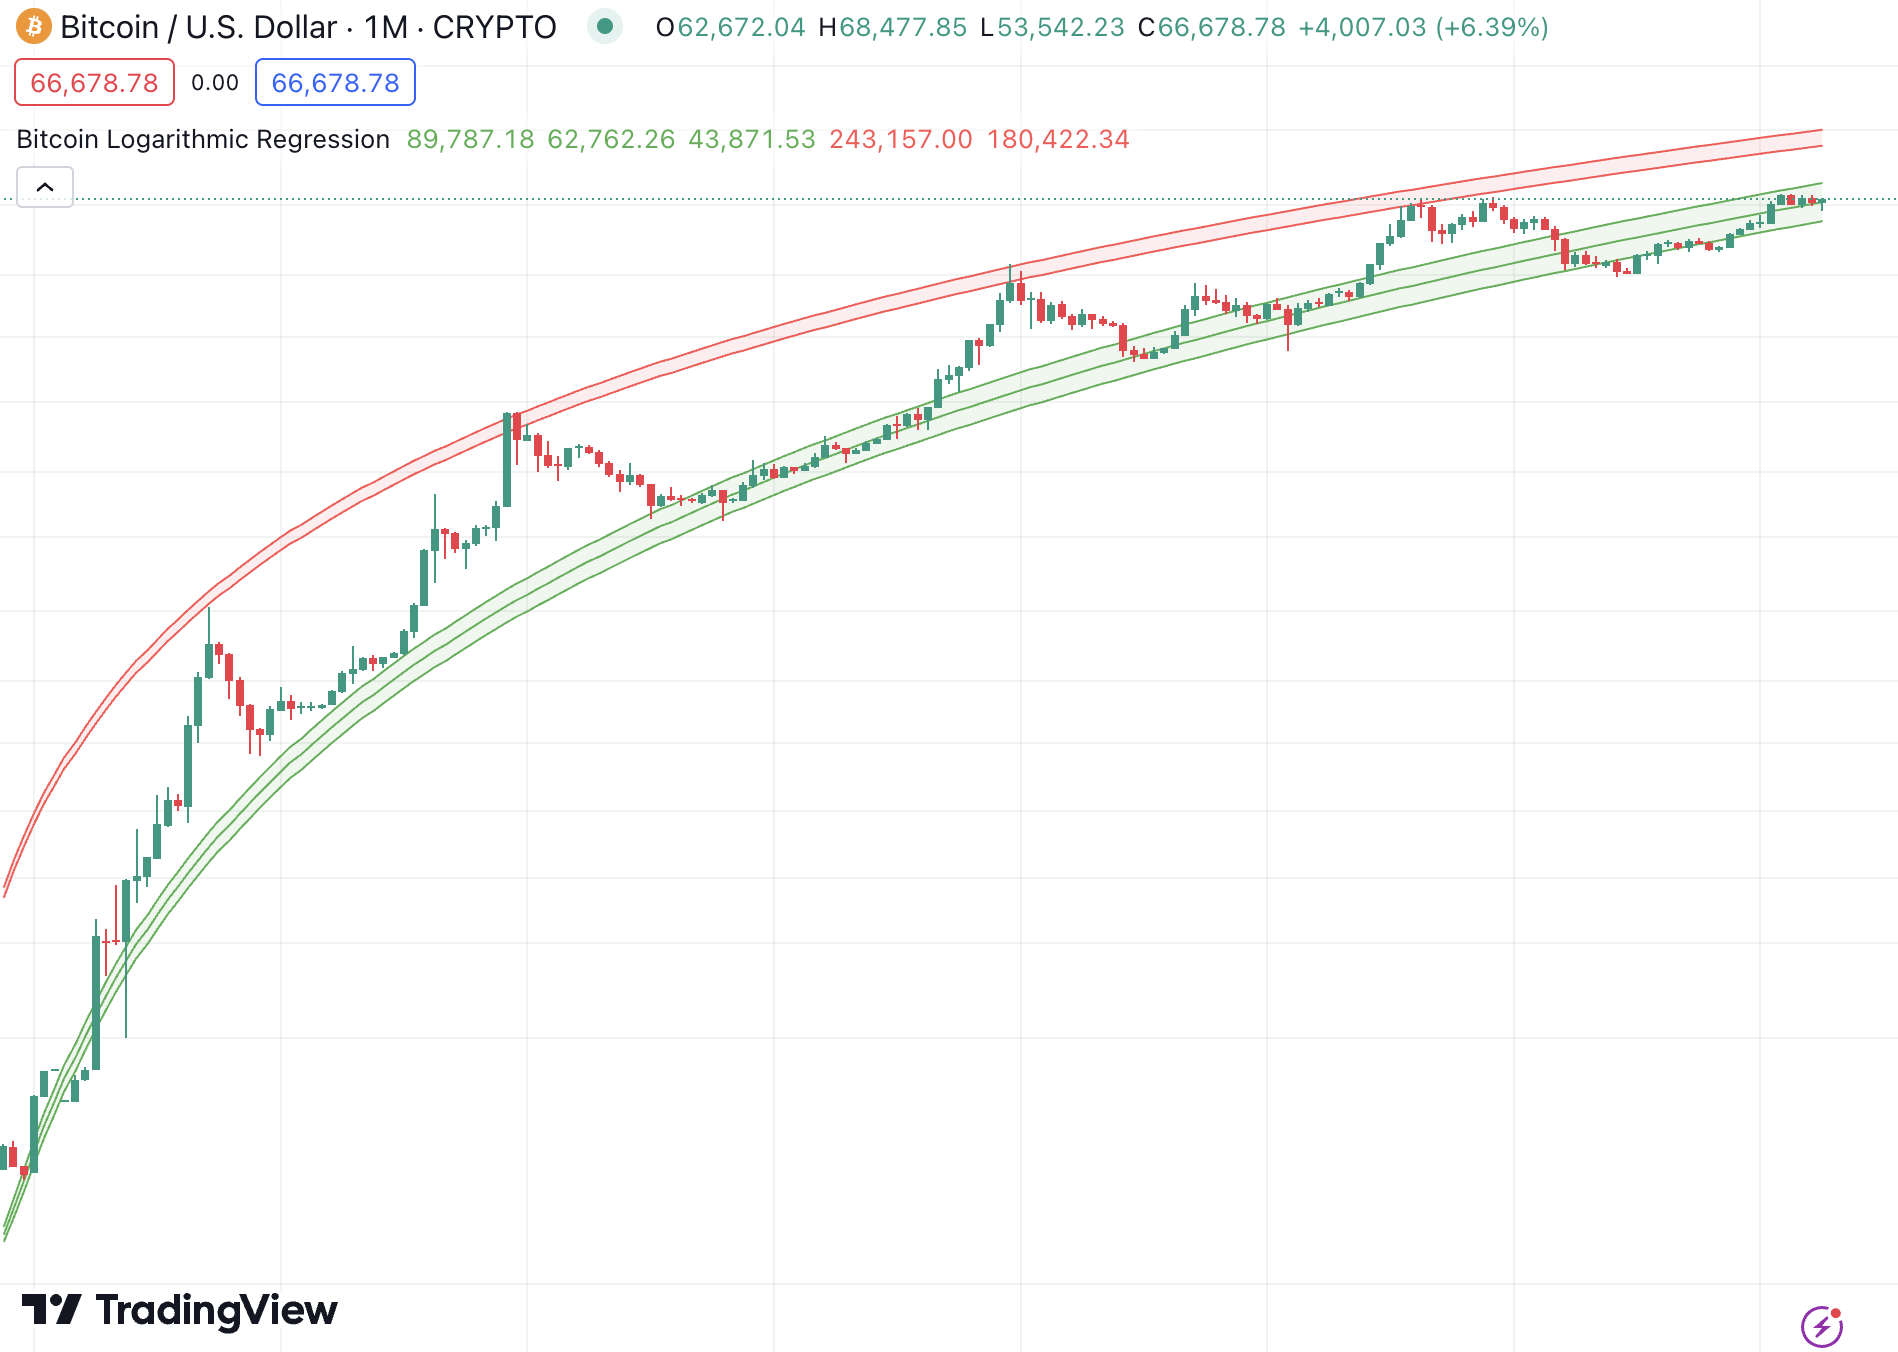
With the rainbow overlay, the chart further smoothens out extreme volatility. The result is an easy-to-understand chart that provides a clearer long-term perspective of Bitcoin. This enhanced visualization helps compare the current price of Bitcoin with its historical highs and lows. It also helps identify recurring patterns and trends in Bitcoin’s price movement.
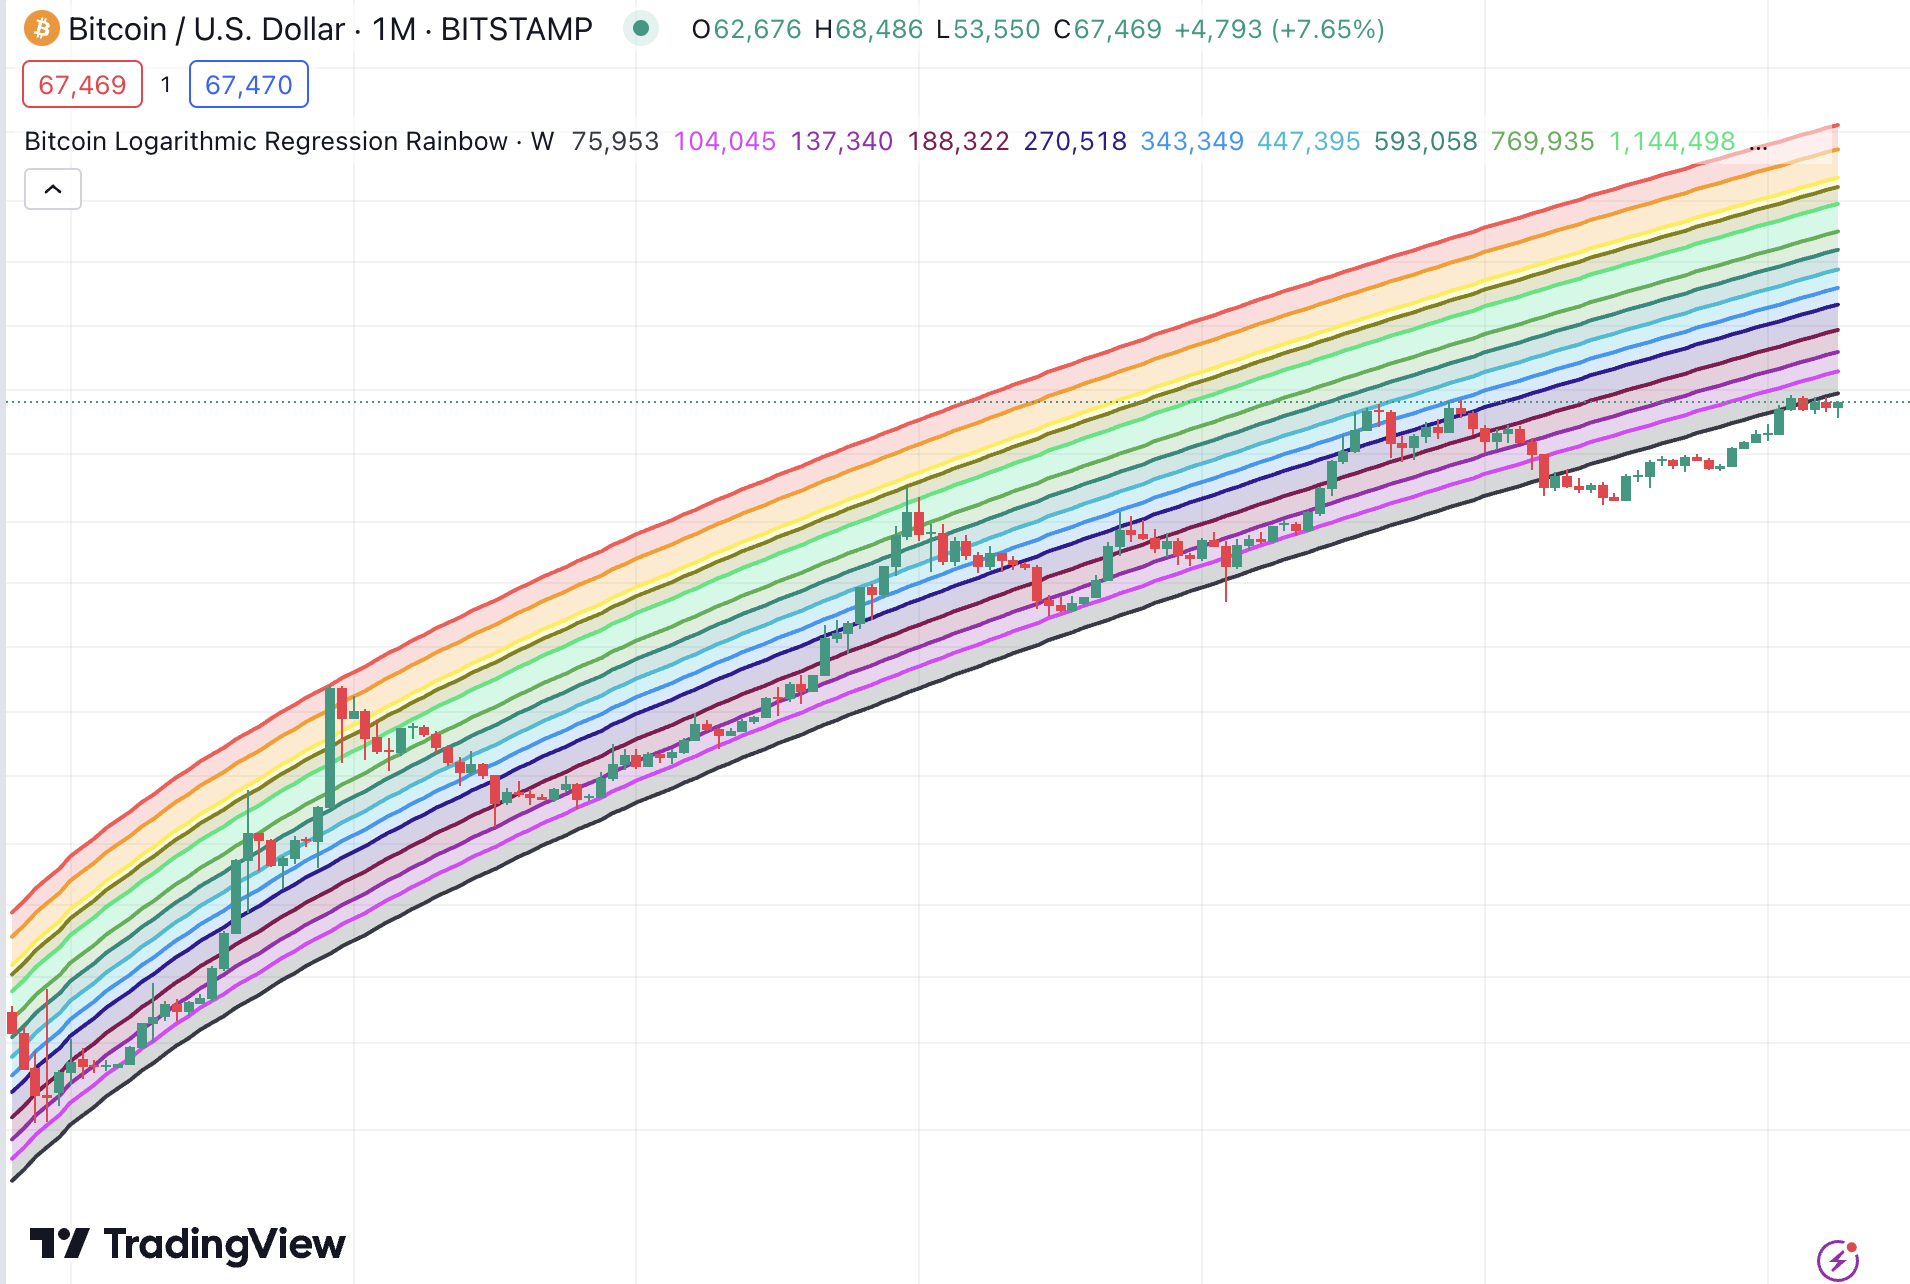
The Colors of the Bitcoin Rainbow Chart
The color bands on the Bitcoin Rainbow Chart provide visual cues about whether Bitcoin is potentially overbought or oversold.
As mentioned, this chart has nine bands in the following order – from top to bottom:
Dark Red Band – Maximum Bubble Territory
The dark red band on the top of the Rainbow Chart suggests that Bitcoin is heavily overbought. If Bitcoin trades at this point, it typically means a crucial market correction or crash is on the way. Put otherwise, if you own Bitcoin, it might be a good time to sell.
Otherwise, you might witness a sizable price correction. It’s also considered an unsafe period to buy Bitcoin. For instance, in December 2017, Bitcoin reached nearly $20,000 (its highest price then), entering the dark red band. Traders who sold at this peak avoided the dramatic drop to around $6,000 in early 2018.
Red Band – Sell. Seriously, SELL!
This zone suggests that Bitcoin is trading at high prices. It’s another indication to sell. In other words, it shows that Bitcoin is in unsustainable territory. Investors not HODLing Bitcoin should consider collecting their profits at this point.
Orange – Fomo Intensifies
When the price of Bitcoin is in the orange band, it suggests that market enthusiasm is increasing. Its value could go up because of FOMO (fear of missing out). In other words, buyers are still dominating the market.
Light Orange – Is This a Bubble?
The light orange color band on the Bitcoin Rainbow Chart implies that the price may be entering a speculative bubble phase.
During this period, market enthusiasm is high, and there’s a growing concern that prices could be rising too quickly. Meaning – they could be unsustainable. At this stage, it might be best to refrain from any action and see how the market moves.
Yellow – HODL
If Bitcoin is in the yellow color band, the market is considered neither bullish nor bearish. This indicates a good time to hold on to existing Bitcoin investments – expecting further price increases.
Light Green – Still Cheap
In the light green phase, the Bitcoin price is considered relatively cheap for long-term investors to buy. However, those already owning Bitcoin might want to hold on to their investment, rather than increasing their exposure.
Green – Accumulate
The green color band signals that the price of Bitcoin is relatively cheap compared to its potential value. In other words, this is a good time to buy Bitcoin.
Light Blue – Buy
When the price of Bitcoin drops to the light blue band, it’s considered undervalued. An investor might want to start buying Bitcoin to benefit from low prices. For instance, in early 2019, the price of Bitcoin hovered around $3,000 to $5,000.
Those who bought Bitcoin around this price saw their investments grow significantly. By July 2019, the price of Bitcoin rose to nearly $11,000 and was in the yellow band.
Blue – Basically a Fire Sale
The blue band of the Rainbow Chart Bitcoin indicates that it’s trading at an undervalued price. This is a window for investors to add more Bitcoin to their portfolios.
Since its inception, the Bitcoin price entered the blue zone in 2015 and 2022. Both these periods were followed by significant gains in the upcoming years.
Advantages of Using the Bitcoin Rainbow Chart for Predictions
There are certain advantages to using the Bitcoin Rainbow Chart 2024 for analysis. In this section, we look at how this chart can help with your market predictions.
Simplified Representation
Perhaps the biggest advantage of the Rainbow Chart is its simplified visual representation of Bitcoin’s long-term price trends. Typically, the standard price chart of Bitcoin bogs down traders because of the short-term volatility.
In contrast, the Bitcoin Rainbow Chart uses color codes. Each color symbolizes a different phase of market sentiment. This visual differentiation helps traders gauge whether Bitcoin is currently undervalued, fairly valued, or overvalued.
Historical Context
Another notable advantage of the Bitcoin Rainbow Chart 2024 is its ability to provide historical context. This chart uses historical data, allowing you to analyze how Bitcoin performs currently compared to past trends. This lets you identify recurring cycles that may influence Bitcoin’s future price movements.
For instance, whenever the Bitcoin price entered the lower color bands, these were times of accumulation and recovery. Conversely, when the price reaches the upper bands, it often signals overvaluation and the potential for a market correction. However, bear in mind that the historical pattern might not always repeat.
Remove Short-Term Clutter
The Rainbow Chart provides a clear and more manageable view of Bitcoin’s long-term price trends. Traditional price charts often display significant volatility, fluctuating wildly within short periods. This can create a noisy and confusing picture for traders, making it difficult to discern underlying trends and patterns.
In comparison, the Bitcoin Rainbow Chart smooths out the extreme volatility. It helps investors maintain a strategic focus, reducing the chance of making hasty decisions based on temporary market conditions.
Bitcoin Rainbow Chart vs. Stock-to-Flow Model
There is a lot of skepticism surrounding the accuracy of the Bitcoin Rainbow Chart. Not so surprisingly, it’s often compared to other popular analysis tools to gauge its effectiveness.
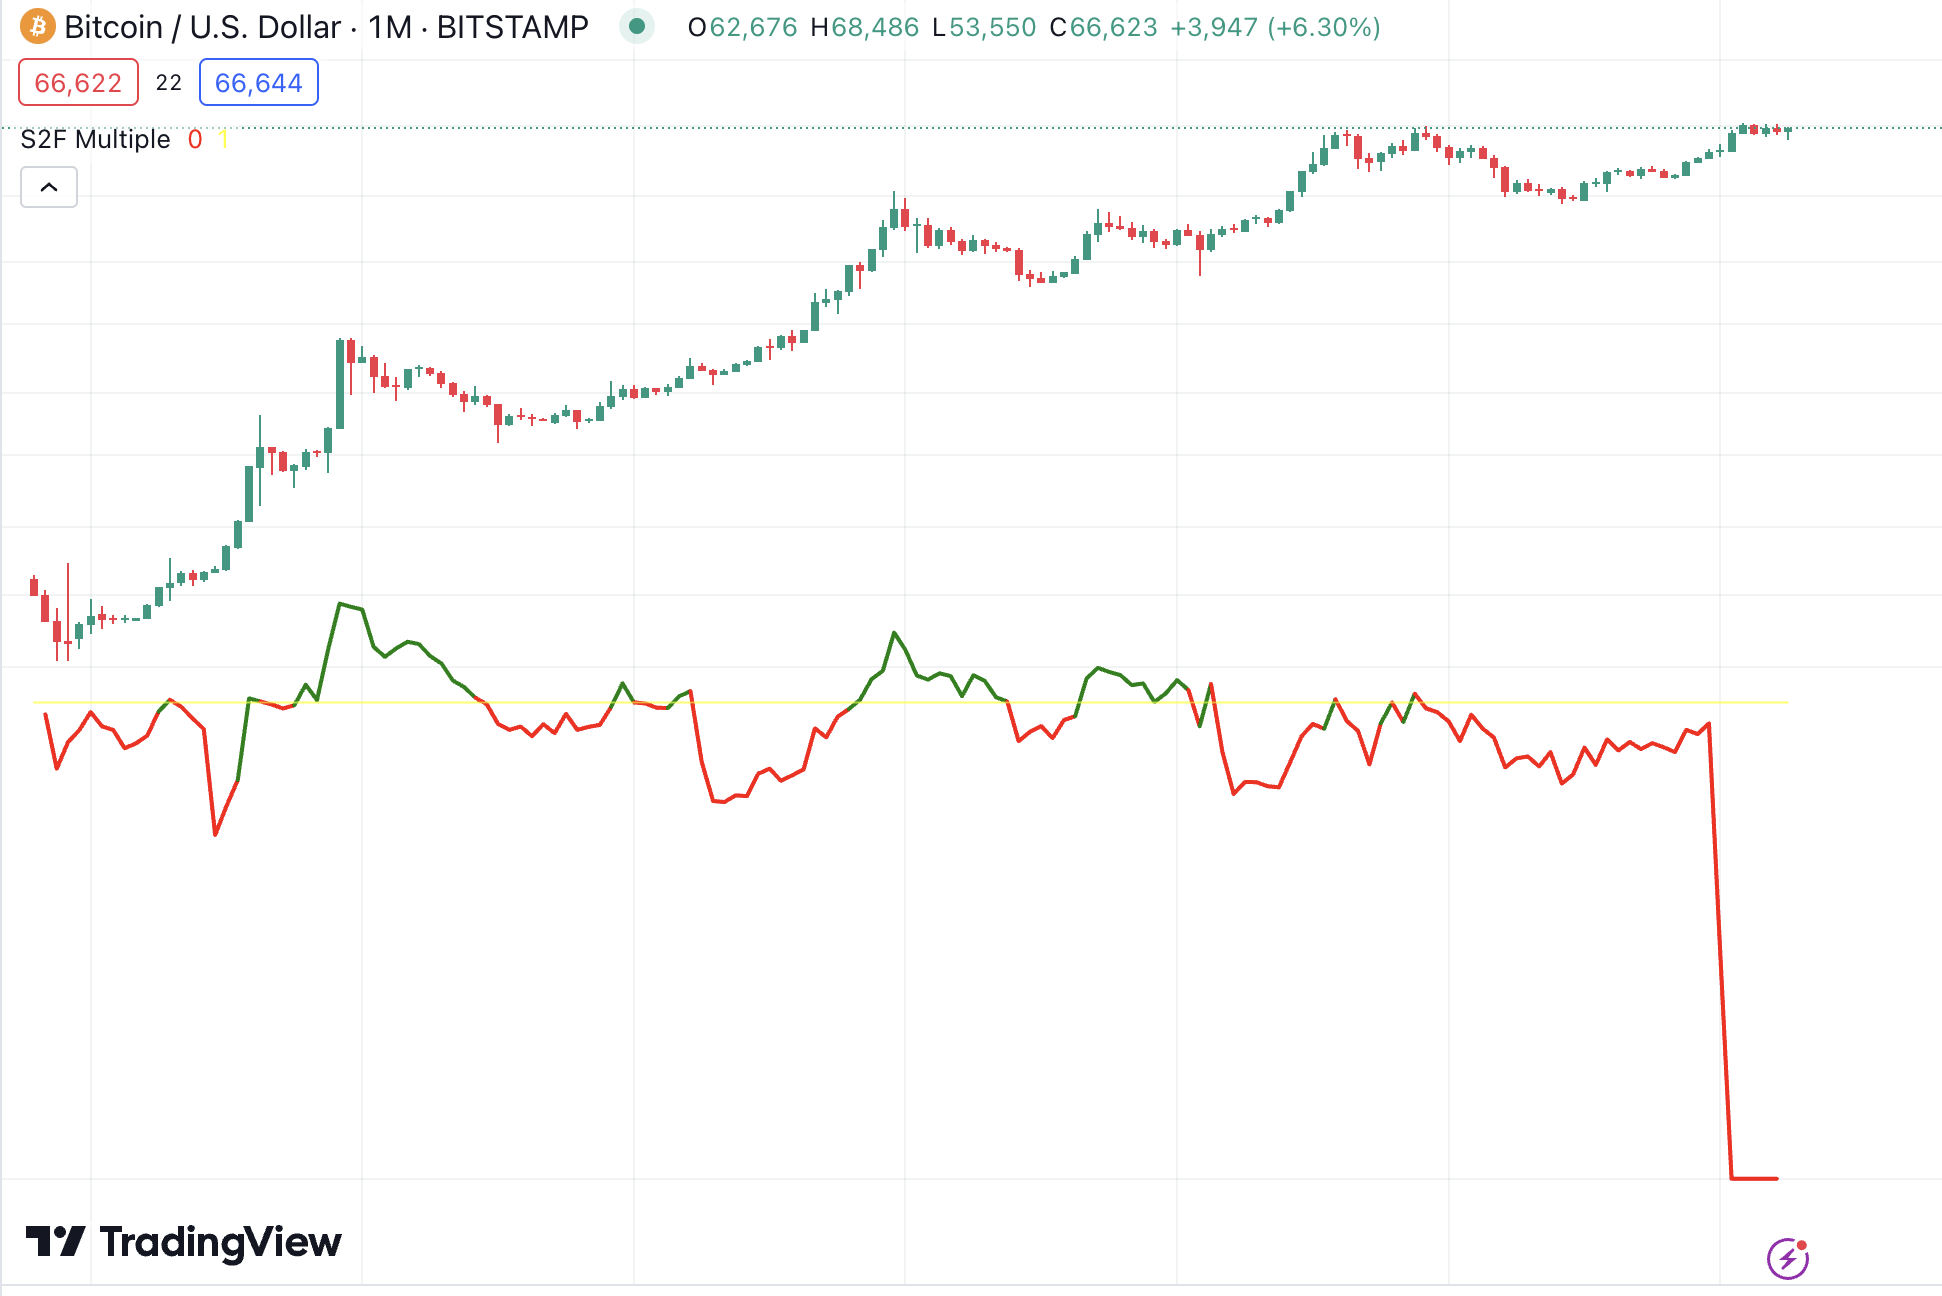
Below, we explore how the Rainbow Chart differs from the Stock-to-Flow Model (S2F) of Bitcoin.
- We’ve established that the Bitcoin Rainbow Chart uses logarithmic regression to map Bitcoin’s historical price data against a color-coded spectrum. On the other hand, the Stock-to-Flow model uses a quantitative approach based on Bitcoin’s supply dynamics.
- The S2F model relies on the principle that as Bitcoin becomes scarcer due to its halving events, its value should increase. It compares the existing supply of Bitcoin (stock) to the newly mined supply (flow) to predict its future price.
- The Rainbow Chart is useful for those who prefer a visually intuitive tool. In comparison, the S2F model appeals to those favoring a more rigorous, quantitative analysis.
Stock-to-flow is a valuable model for measuring scarcity. However, it doesn’t consider all of the problems in the aggregate – just like the Bitcoin Rainbow Chart. Therefore, it’s best to use these two tools in combination. In doing so, you can get a comprehensive view of the potential price movements of Bitcoin.
Sentiment Analysis Tools vs. Bitcoin Rainbow Chart
Market sentiment analysis tools are significant in analyzing volatile assets. In simple terms, these tools gauge the overall mood of investors towards Bitcoin. Typically, sentiment analysis tools aggregate data from various sources, including social media platforms, news articles, forums, and other online communities.
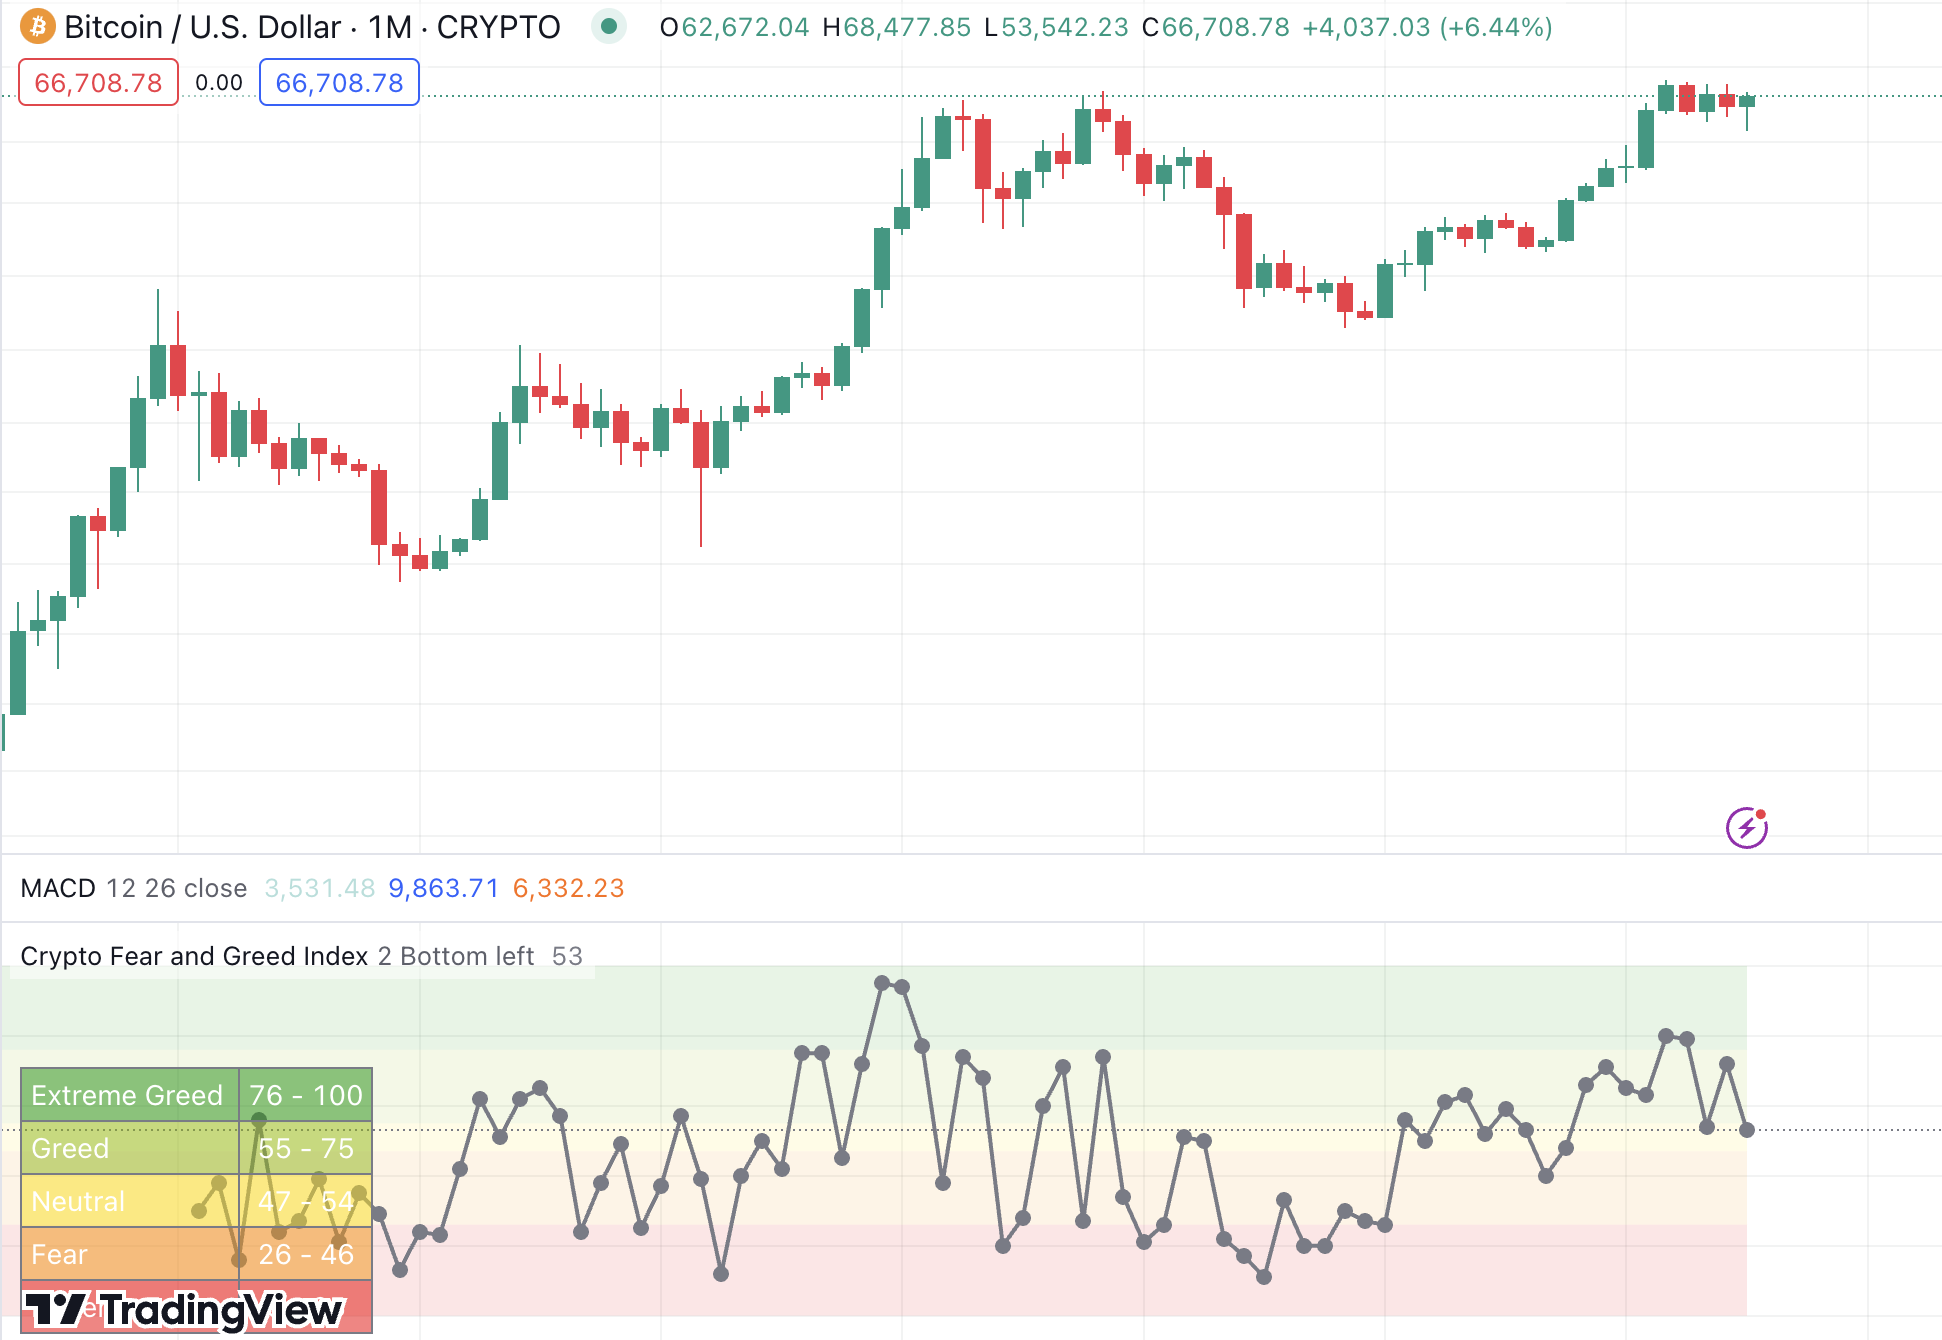
These tools then analyze the frequency and context of mentions, keywords, and sentiments expressed in these sources. This way, you get a snapshot of market emotions, whether bullish, bearish, or neutral. One example of a sentimental analysis tool is the Crypto Fear & Greed Index.
This tool helps you identify potential buying or selling opportunities. There are also third-party platforms offering insight into market sentiments.
Crucially, sentiment analysis tools and the Bitcoin Rainbow Chart serve different purposes.
For instance:
- Sentiment analysis is critical for short-term trading and for tracking quick price movements.
- In contrast, the Bitcoin Rainbow Chart offers a broader view, helping investors maintain a long-term perspective and avoid making impulsive decisions based on short-term market noise.
However, by combining both these tools, investors can enhance their decision-making.
Limitations of the Bitcoin Rainbow Chart Indicator
As mentioned, the Bitcoin Rainbow Chart isn’t a completely reliable tool. In fact, this chart has many limitations that investors should be aware of.
Doesn’t Reflect Real-time Data
The Rainbow Chart Bitcoin uses historical data. As such, it doesn’t incorporate real-time price movements. Meaning – the chart cannot take into account sudden market changes. This limitation becomes especially important during high volatility or when unexpected events occur.
For instance, the Bitcoin price is often affected by geopolitical events, sudden regulatory announcements, major news stories, or even a Tweet. Since the Rainbow Chart cannot update dynamically to reflect these changes, it provides a misleading market view.
Arbitrary Color Bands
The color spectrum on the Rainbow Chart Bitcoin is somewhat arbitrary. After all, it was initially created for visual appeal rather than precise market analysis. This means that there is no accurate data-driven foundation for its significance.
Consequently, investors might misinterpret these bands as definitive signals. The arbitrary nature of the Bitcoin Rainbow Chart Indicator makes it less reliable for supporting investment decisions.
Subjective Interpretations
As with all technical analysis tools, the Bitcoin Rainbow Chart Indicator is also interpreted subjectively. For instance, if the price of Bitcoin is in the yellow band, one trader might interpret it as a sign of an imminent crash. They might choose to sell their Bitcoin.
On the other hand, another trader might consider the phase a bubble and that Bitcoin might soon recover. This trader might choose to hold their Bitcoin, anticipating a rebound. These different interpretations can lead to potential inconsistencies in decision-making.
Not Suitable for Short-Term Trading
The Rainbow Chart is intended for long-term trends – typically months or years. This tool is best for those interested in understanding the broader market cycle of Bitcoin. However, its suitability diminishes significantly when applied to short-term trading decisions.
Tips for Using the Bitcoin Rainbow Chart (BRC) 2024
The BRC remains a popular tool for visualizing its long-term trends. However, investors need to exercise extra caution.
Here are some tips to remember when leveraging the Rainbow Chart for Bitcoin price predictions.
Use BRC With Other Indicators
Given its many limitations, an investor shouldn’t rely solely on the Rainbow Chart. Nevertheless, it can be employed as a complementary tool along with other forms of analysis. For instance, investors should always watch out for market news and updates related to the crypto industry.
Additionally, investors can use the Bitcoin Strength Index or Moving Averages to confirm trends from the Rainbow Chart. This multifaceted approach can reduce risk before buying or selling Bitcoin.
Watch the Market Actively
Needless to say, the cryptocurrency market is volatile and can alter rapidly. Therefore, you must regularly update your analysis by comparing the Rainbow Chart with current market conditions. Such periodic reviews ensure that you account for any new shifts in the market sentiment.
Incorporate Risk Management Strategies
No matter the type of strategy you use, it’s essential to incorporate crypto risk management techniques. For instance, don’t risk all your money on Bitcoin. Instead, allocate only a portion of your portfolio. Similarly, set stop-loss orders for your investments.
Even if you’re HODLing Bitcoin for the long term, having a stop-loss order in place can help you limit potential losses.
If the value of Bitcoin drops considerably, you can buy more Bitcoin at a lower price later, assuming you still believe in its long-term potential. This approach allows you to manage risk while potentially profiting from upcoming price increases.
If you want to trade Bitcoin, using the Rainbow Chart alone will be insufficient. With its notorious volatility, Bitcoin demands fast and efficient tools. This is why you might want to consider automated bots. Algobot is one of the best trading bots available today. It uses artificial intelligence and algorithms to scan the market constantly. Since Algobot is fully automated, it can also execute Bitcoin trades. The buying and selling opportunities are based on signals generated by technical indicators. In other words, Algobot offers a complete passive trading experience. Algobot also lets you choose your risk level. Additionally, if needed, you can also switch to semi-automated and manual bots. Aside from Bitcoin, Algobit also supports other crypto coins, stocks, commodities, forex, and indices.
The Best Way to Trade Bitcoin
Conclusion
The Bitcoin Rainbow Chart offers a long-term perspective of Bitcoin’s price action. It lets investors assess whether the current price of Bitcoin is relatively high or low based on historical trends. However, the Rainbow Chart doesn’t account for all market factors.
It relies on historical data and doesn’t consider real-time market changes. Therefore, it’s most effective alongside other technical indicators and market analysis tools. This combined approach provides a more comprehensive market view, helping investors make more informed decisions.
FAQ
What is the BRC?
The Rainbow Chart uses logarithmic regression and rainbow-colored bands to depict Bitcoin’s long-term price trends. It helps investors gauge whether Bitcoin is undervalued or overvalued based on historical price movements.
Is the Rainbow Bitcoin Chart accurate?
The Bitcoin Rainbow Chart Indicator is based on historical data and doesn’t consider future market conditions. Therefore, it isn’t considered perfectly accurate.
Can the Rainbow Chart predict the price of Bitcoin?
The Bitcoin Rainbow Chart doesn’t predict the exact future price of Bitcoin. Instead, it helps investors understand Bitcoin’s market cycles based on historical price data.
How should I use the Bitcoin Rainbow Chart?
The Bitcoin Rainbow Chart works best with other technical tools and fundamental analysis methods. It provides a long-term perspective but shouldn’t be used exclusively for trading decisions.
How frequently should I check the Bitcoin Rainbow Chart?
The Bitcoin Rainbow Chart is designed for long-term analysis. Therefore, it’s smart to check it periodically, such as monthly or quarterly, which is usually sufficient.