Technical analysis is an approach traders use to forecast an asset’s future price action. This method can be insightful to identify trends and price patterns in the index market.
This guide walks you through the ins and outs of index trading with technical analysis tools. We also explore proven technical systems and strategies to enhance your index investment goals.
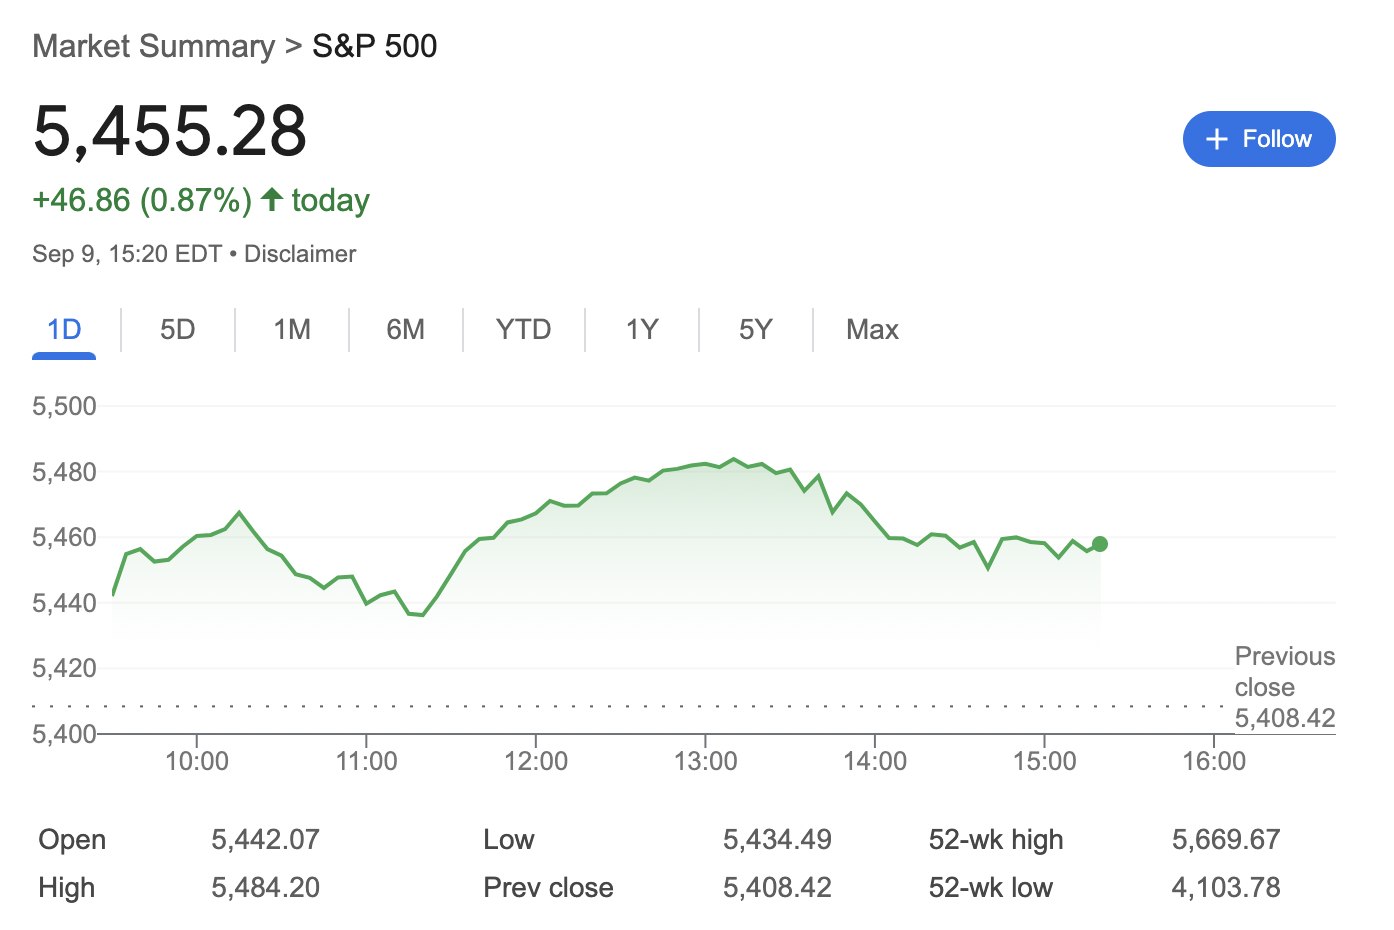
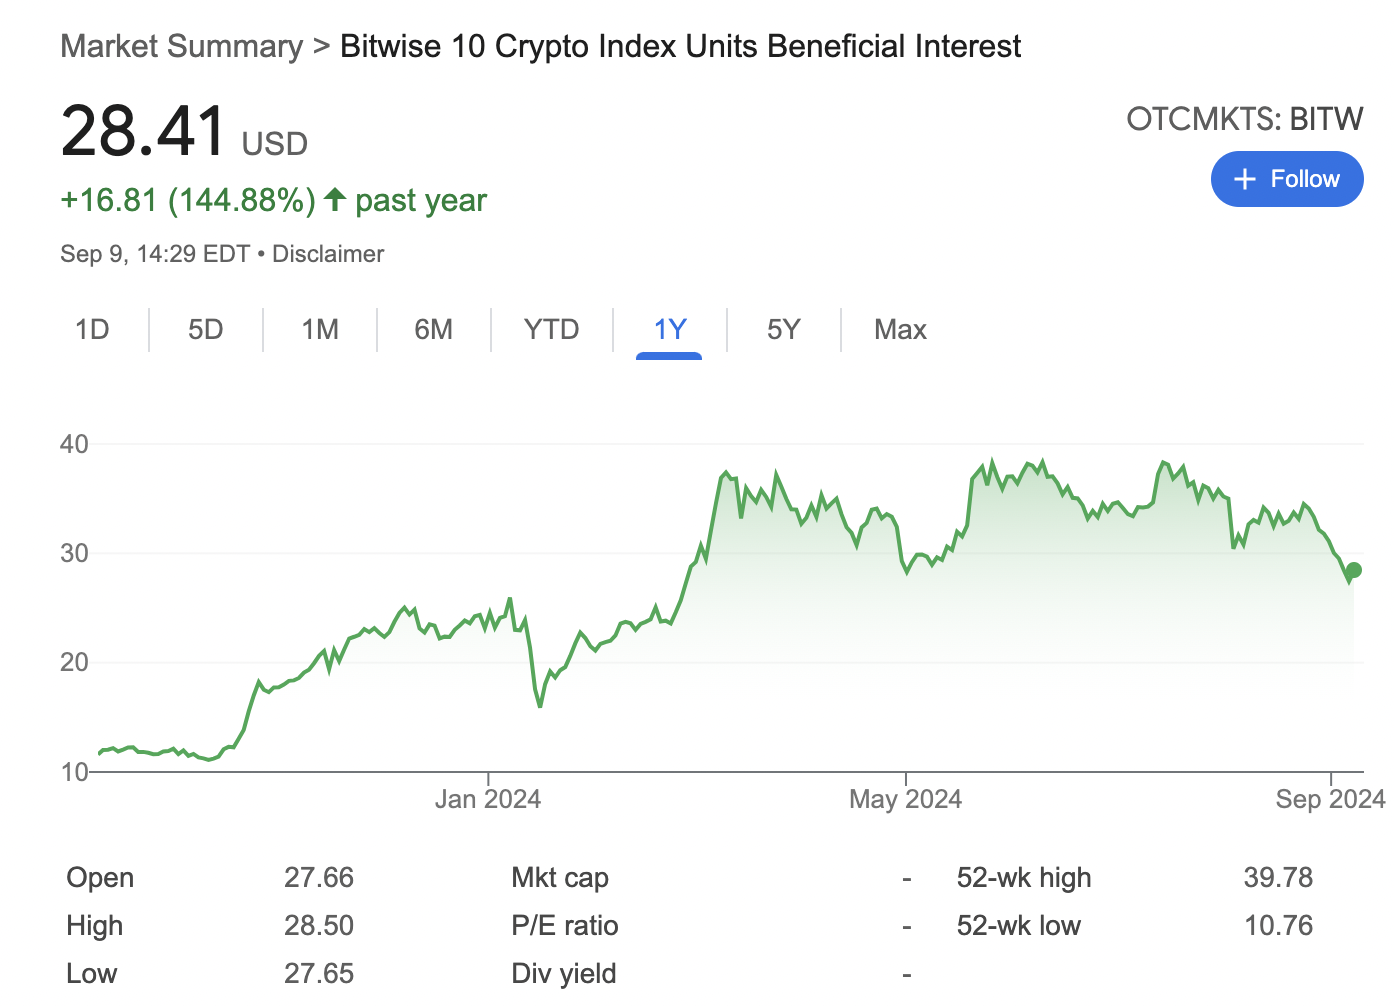
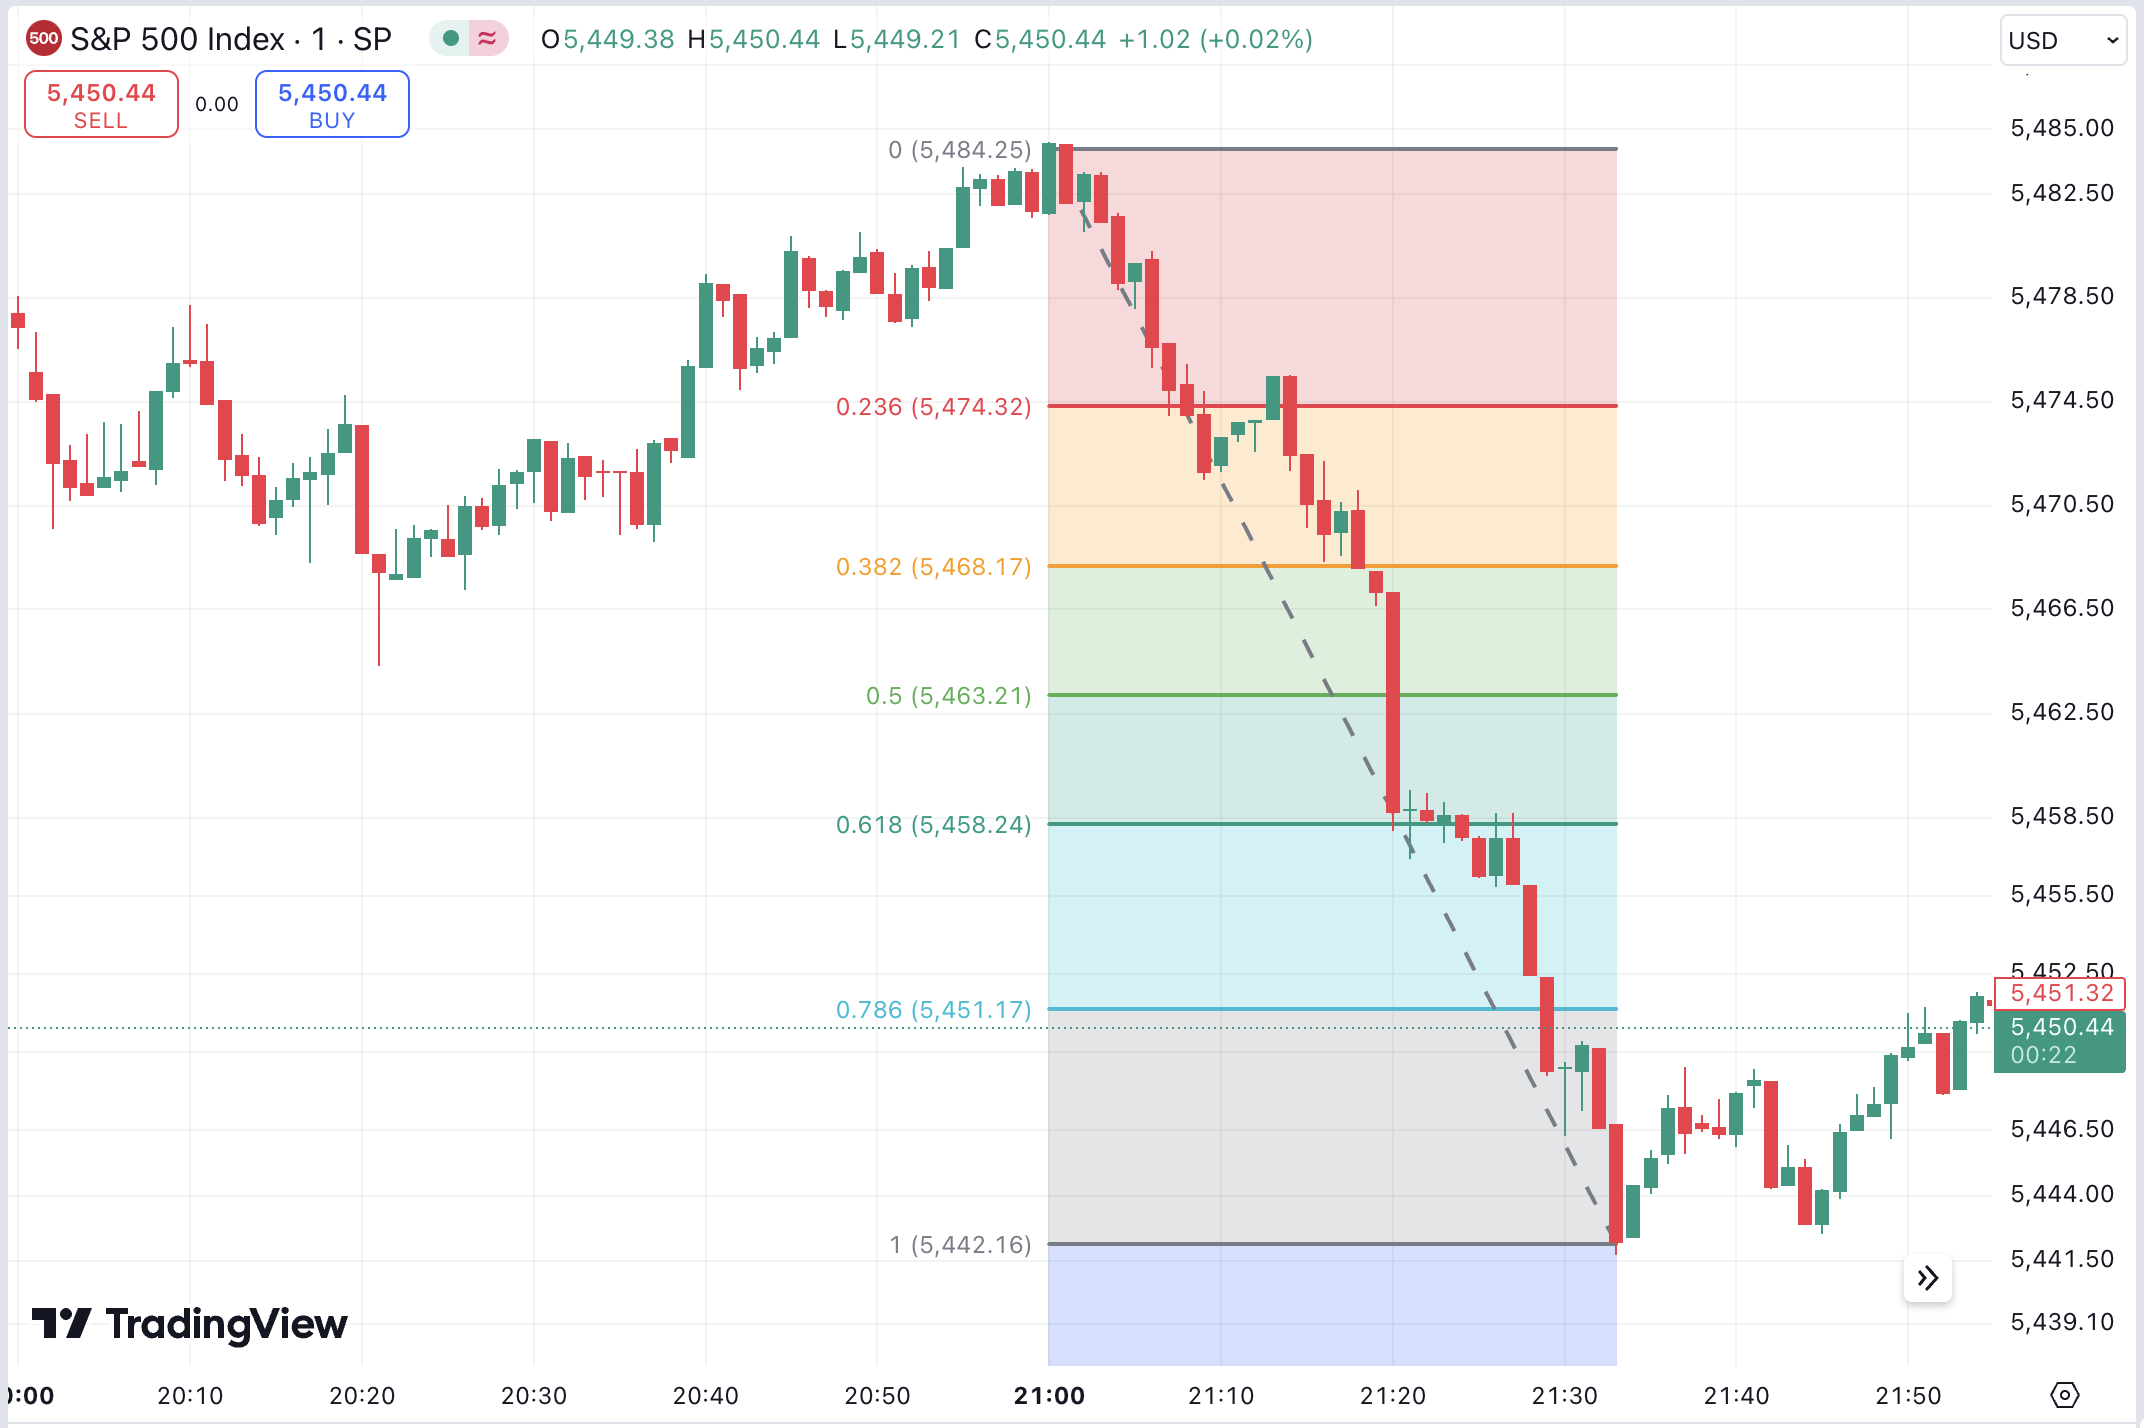
Here are the key points regarding technical analysis for index trading: In financial sectors, an index is a statistical measure that tracks the performance of an asset group. This could be stocks, forex, crypto, bonds, or other securities. It provides a snapshot of a particular market segment’s performance. For instance, the S&P 500 Index is one of the most popular stock indexes. It tracks 500 large-cap U.S. companies. The S&P GSCI, on the other hand, represents the global commodities markets. However, you cannot trade an index directly. Instead, you trade financial instruments that track the index’s performance – such as Exchange-Traded Funds (ETF) or derivatives. The primary advantage of index trading is diversification, which helps reduce risk by spreading exposure across multiple assets. In trading, technical analysis is used to assess and predict the upcoming price movements of assets. It relies on historical price data and trading volumes to make predictions. This contrasts with fundamental analysis – which examines an asset’s economic, financial, and other qualitative factors. Technical analysis provides actionable insights for short-term index trading – such as: Technical analysis therefore lets you adapt to different market conditions. For example, suppose you’re day trading the S&P 500 Index. Technical indicators like the Moving Average (MA) or Relative Strength Index (RSI) can further refine these insights. They inform whether the index is overbought or oversold. By studying these technical factors, traders can decide on their position timing. There are several index trading categories, each catering to different financial markets. The indexes accessible to you depend on the chosen broker. This involves trading the performance of a specific group of stocks. These indexes speculate on the stock market’s overall movement without investing in individual companies. Examples include the S&P 500, which tracks 500 large-cap U.S. companies, and the FTSE 100, which represents the top 100 firms listed on the London Stock Exchange. There are also stock indexes from Europe, such as DAX, and India, like the Nifty 50. Forex indexes track a basket of currency pairs. For example, the U.S. Dollar Index (DXY) measures the value of the U.S. dollar against a basket of major currencies, including the Euro, Yen, and Pound. However, forex indexes can be complex due to the interplay between multiple currencies and global economic factors. For this reason, these indexes are often traded by professionals with advanced analytical skills. Additionally, forex trading bots could also be an effective tool for experienced traders. Commodity market indexes track the performance of hard and soft commodities. This includes oil, gold, wheat, and other raw materials. These indexes give you exposure to global commodities without holding physical assets. For example, a trader using the S&P GSCI might be interested in the general performance of commodities. This index covers five major sectors – energy, agriculture, livestock, industrial, and precious metals. On the other hand, the Bloomberg Silver Subindex tracks the price of just silver. Investors widely engage in commodity index trading to hedge against inflation or diversify their portfolios. Crypto indexes are also gaining popularity. These follow a variety of digital assets, such as Bitcoin, Ethereum, and other altcoins. For example, the Bitwise 10 Large Cap Crypto Index tracks the top 10 largest digital assets by market capitalization. Since crypto is severely volatile, trading these indexes demands thorough consideration and solid risk management. The volatility can result in wild price swings, affecting short-term and long-term investment outcomes. Technical analysis tools like trend lines, MA, and RSI can help traders navigate this volatility by identifying key price patterns and trends. As mentioned, index trading is facilitated using various financial instruments. We discuss the most common options in the sections below. ETFs are one of the most widely used instruments in index trading. They offer an easy way to trade without directly holding the underlying asset. ETFs trade on major exchanges just like stocks. As such, buying and selling them throughout standard market hours is easy. They also offer the benefits of diversification. For ETF index trading, common technical indicators such as MA and RSI are used. These help gauge trends and potential reversals of wider markets. Index options give you the right to buy or sell an underlying index’s value at a specified (strike) price. However, executing the trade before the expiration date is not obligated. You’ll buy Call options if you expect the index to go up. For example: Conversely, if you expect the index to fall, you would buy a Put option. This gives you the right to sell the index at a higher price. Index futures trading involves purchasing or selling contracts. They require you to trade an index at a predetermined price on a specified future date. Unlike options, futures come with the obligation to make the trade. However, index futures are widely used, making them highly liquid. Let’s look at an example of an index futures trade. Futures also offer high leverage. Small price changes can result in significant profits. But also substantial losses, due to market volatility and the possibility of margin calls. Contracts for Difference (CFDs) also allow you to trade index price action without owning the underlying assets. CFDs can be used to go long and short. Moreover, they can also be traded on margin. However, since CFDs are often leveraged, losses also accumulate quickly. Nevertheless, index CFDs are attractive for short-term traders due to their flexibility. There’s a misconception that technical analysis only involves indicators. However, to effectively analyze price movements, traders also often rely on drawing tools. Below, we explain the most common technical analysis tools and how to use them. Candlestick charts are the most used aspect of technical analysis. They display price action over a specific period – open, close, high, and low prices. The bullish candles are represented in green, and the bearish in red. Each candlestick represents a time frame and has a ‘body’ and ‘wicks’. Traders analyze these charts to identify patterns and trends. There are many more patterns that portray different potential price actions. Learning them can help you decide on your next index trading move. Support and resistance levels are crucial for understanding where an index might change direction. These levels are pinpointed by historical price data – where the index has repeatedly bounced off or struggled to break through. For example, if the S&P 500 Index has repeatedly bounced back from 10,000, this level is considered support. There are a variety of tools used to identify support and resistance levels – such as: You can also find built-in indicators that identify support and resistance levels on the index’s price chart. Trendlines identify the direction of an index’s movement. A trendline is drawn connecting significant highs or lows on a chart. Properly drawn trendlines visually represent the market’s overall direction. Some built-in tools automatically draw trend lines on charts. Put simply, an uptrend line is drawn by joining the higher lows. This suggests a bullish trend. On the other hand, a downtrend line touches lower highs. Trendlines can also act as support or resistance levels. When the index approaches a trendline, it may bounce off or breakthrough. This suggests potential reversals or continuations. Indicators are perhaps the most important component of technical analysis. These tools can be widely categorized into four – trend, momentum, volume, and volatility. Below, we discuss each category’s most popular technical indicators for index trading. Trend indicators help determine the direction of the market. For instance, they tell if the index is in an uptrend, downtrend, or moving sideways. They remove the noise of short-term volatility to highlight the main trend. Here are commonly used trend indicators: Trend indicators are most useful when the market moves in one direction. They help traders stay in the market as long as the trend is strong. These indicators are essential for gauging how strong a price movement is. They measure the pace of an asset’s price change. Here are two popular momentum indicators: Ultimately, momentum indicators are used to determine if the current trend will continue or weaken. Market volume highlights the number of index derivatives traded over a specific period. A high trading volume often confirms the validity of a price trend. If the volume is low, it might be better to wait. You can use these volume indicators for index trading: Volatility measures how much the index’s price changes over time. If indicators suggest high volatility, it means large price swings are occurring. And a low volatility points to steadier price movements. Bollinger Bands is the most used volatility indicator. It has a middle band (usually a 20-day MA). Then, two outer bands are set on either side of the middle one. If the price moves towards the upper Bollinger Band, it indicates that the index is becoming overbought. On the other hand, if the index price touches the lower band, it might suggest it’s oversold. Your index trading success will ultimately be determined by your strategy. Below, we’ve outlined how you can develop a trading plan that benefits your trading objectives. First and foremost, identify your goal. Equally important is defining how much risk you’re comfortable taking. Can you afford to lose 1% of your capital per trade, or is 5% acceptable? Knowing these limits keeps you grounded during market volatility. Deciding which index to trade is essential when creating a tailored strategy. The volatility of indexes varies widely depending on the sector. Your country of residence will also determine which indexes you can access. For instance: Whether you’re interested in forex or stock market index trading, remember that each index has its own behavior and influencing factors. This includes interest rates, market news, or geopolitical risks. Before choosing one, research the characteristics of each market, including volatility, liquidity, and trading hours. There are multiple financial instruments available for index trading. You could trade index ETFs, futures, CFDs, or options. Long-term investors often use ETFs. Whereas futures and CFDs are designed for more active traders. Your choice will depend on your trading frequency, capital, and risk appetite. If you’re a beginner, figuring out your trading style takes some experimentation. It ultimately depends on your time commitment, market outlook, and expertise. Each style has pros and cons, and your choice will dictate your analysis type and tools. Selecting the right technical indicators is crucial for making sound trading decisions. Choose indicators based on your strategy and the current market conditions. You can also use two or more indicators to confirm signals. However, be sure not to use the same type of indicators to avoid redundancy. Before trading with real money, testing your strategy in a demo account is smart. All leading brokers support paper exchanges with simulated market conditions. This allows you to see the performance of your strategy in different conditions. You can also identify areas for improvement without risking any capital. Remember that a single strategy won’t work in all trading conditions. For instance, trend trading won’t work well in a sideways market. Additionally, different markets can be affected by news, regulatory announcements, the economy, and more. Put simply, you’ll need to adjust your approach depending on the market environment. Meaning, you must evaluate your strategy constantly and adjust it to make the most of the identified cycle. Yes, technical analysis is often used for stock index trading. Short-term traders frequently use charting tools and indicators for their strategies. Technical analysis helps spot trends and find the best times to buy or sell. However, bear in mind that technical analysis is optimal when used with fundamental analysis and good risk management. Your index trading broker can impact the trading efficiency and overall success. A reliable brokerage platform should offer essential tools, low fees, and a user-friendly interface. Here are some of the best brokers for index trading. Launched in 2006, AvaTrade is one of the most reputed brokerage platforms. Its strongest standpoint is its compliance with international regulatory bodies. AvaTrade holds nine licenses from authorities across the world. Put otherwise, it’s one of the most secure brokerage platforms. AvaTrade supports a wide range of assets – including stocks, crypto, commodities, and ETFs. It also offers 36 US, European, and Asian indexes. These track the stock, forex, and commodity markets. AvaTrade lets you trade indexes via ETFs and CFDs. Moreover, AvaTrade offers leverage of up to 20x for index trading. It also has a social trading platform called AvaSocial, where you can copy experts’ strategies. AvaTrade doesn’t charge any commissions. Instead, you only need to cover the spread. The platform also has a comprehensive education center, allowing beginners to learn the ropes of index trading. Pros: Cons: eToro is another leading index broker supporting over 6,000 assets. It’s regulated in multiple jurisdictions, including the UK, Europe, the Middle East, Australia, and the US. Thereby, eToro provides access to global exchanges and markets. The broker supports 18 indexes across stocks, commodities, and forex. These can be traded via CFDs or ETFs. Leverage of up to 100x is offered – but the maximum you can access will depend on your location. Other than indexes, eToro also supports individual stocks, forex pairs, commodities, and crypto. eToro is also known for its copy trading features. This allows you to mirror other portfolios. The platform doesn’t charge any commission for ETFs or CFDs. However, if you’re trading stocks directly, you might need to pay a commission (capped at $2), based on your chosen exchange and country. Pros: Cons:
IG is one of the leading platforms for index trading. It gives you access to over 80 indexes from global exchanges. This includes US, Asian, Australian, and European markets. IG also offers a leverage of up to 20x on index CFDs for retail traders. IG also supports weekend index trading. This feature allows hedging of weekday trades by opening a contrasting position on the same index. IG also supports other assets such as stocks, forex, commodities, and crypto. IG spreads are typically competitive. For instance, IG offers a fixed spread starting from 1 point on the FTSE 100. There’s no commission for index CFDs. However, you’ll need to pay overnight fees for leveraged positions. Pros: Cons:
While technical analysis can be invaluable, it also comes with some challenges. Be sure to avoid the common mistakes listed below. As mentioned, using technical analysis for index trading involves a steep learning curve. It takes skill and time to find the right indicators and master them for making trading decisions. However, there are some alternatives to make the process easier. For instance, Algobot is a powerful bot that offers a more accessible and automated solution. It uses a pre-programmed algorithm to use the most suitable technical indicators. It then spots the right trading opportunity and automatically executes trades for you. This approach is especially useful for beginners or traders without enough time to conduct in-depth analysis. But that’s not all. Here are some of the most attractive features of Algobot’s index trading service: In summary, Algobot offers an accessible approach to trading index strategies. It saves time and eliminates the complexity involved with technical indicators.
Technical analysis empowers traders to make better decisions. They can help understand market trends, price movements, and potential shifts. They also let you pinpoint the best moments to enter or exit a trade and manage risk accordingly. However, when trading indexes, it’s paramount to integrate technical tools with fundamental analysis. This provides you with a comprehensive market view. Furthermore, you should also include proper risk management practices to safeguard your capital. Yes, technical analysis can be highly effective for trading index market. It helps traders analyze price trends and decide when to open and close positions. Common technical indicators for trading indexes include MA, RSI, MACD, and Bollinger Bands. These help traders gauge market trends and momentum. No analysis tools guarantee accurate predictions. However, technical analysis can provide invaluable insights for traders and help make educated decisions. Technical analysis helps manage risk by identifying key support and resistance levels. It can also help find stop-loss zones and recognize potential market reversals. Technical Analysis for Index Trading – Key Takeaways
What is Index Trading?
Why Technical Analysis is Crucial in Trading Indexes
Types of Index Trading
Stock Market Index Trading
Forex Market Index Trading
Commodity Market Index Trading
Crypto Market Index Trading
Financial Instruments for Trading Index
Exchange-Traded Funds (ETFs)
Index Trading With Options
Index Trading With Futures
Index Trading With CFDs
Popular Drawing Tools for Index Trading
Candlestick Charts
Support and Resistance Levels
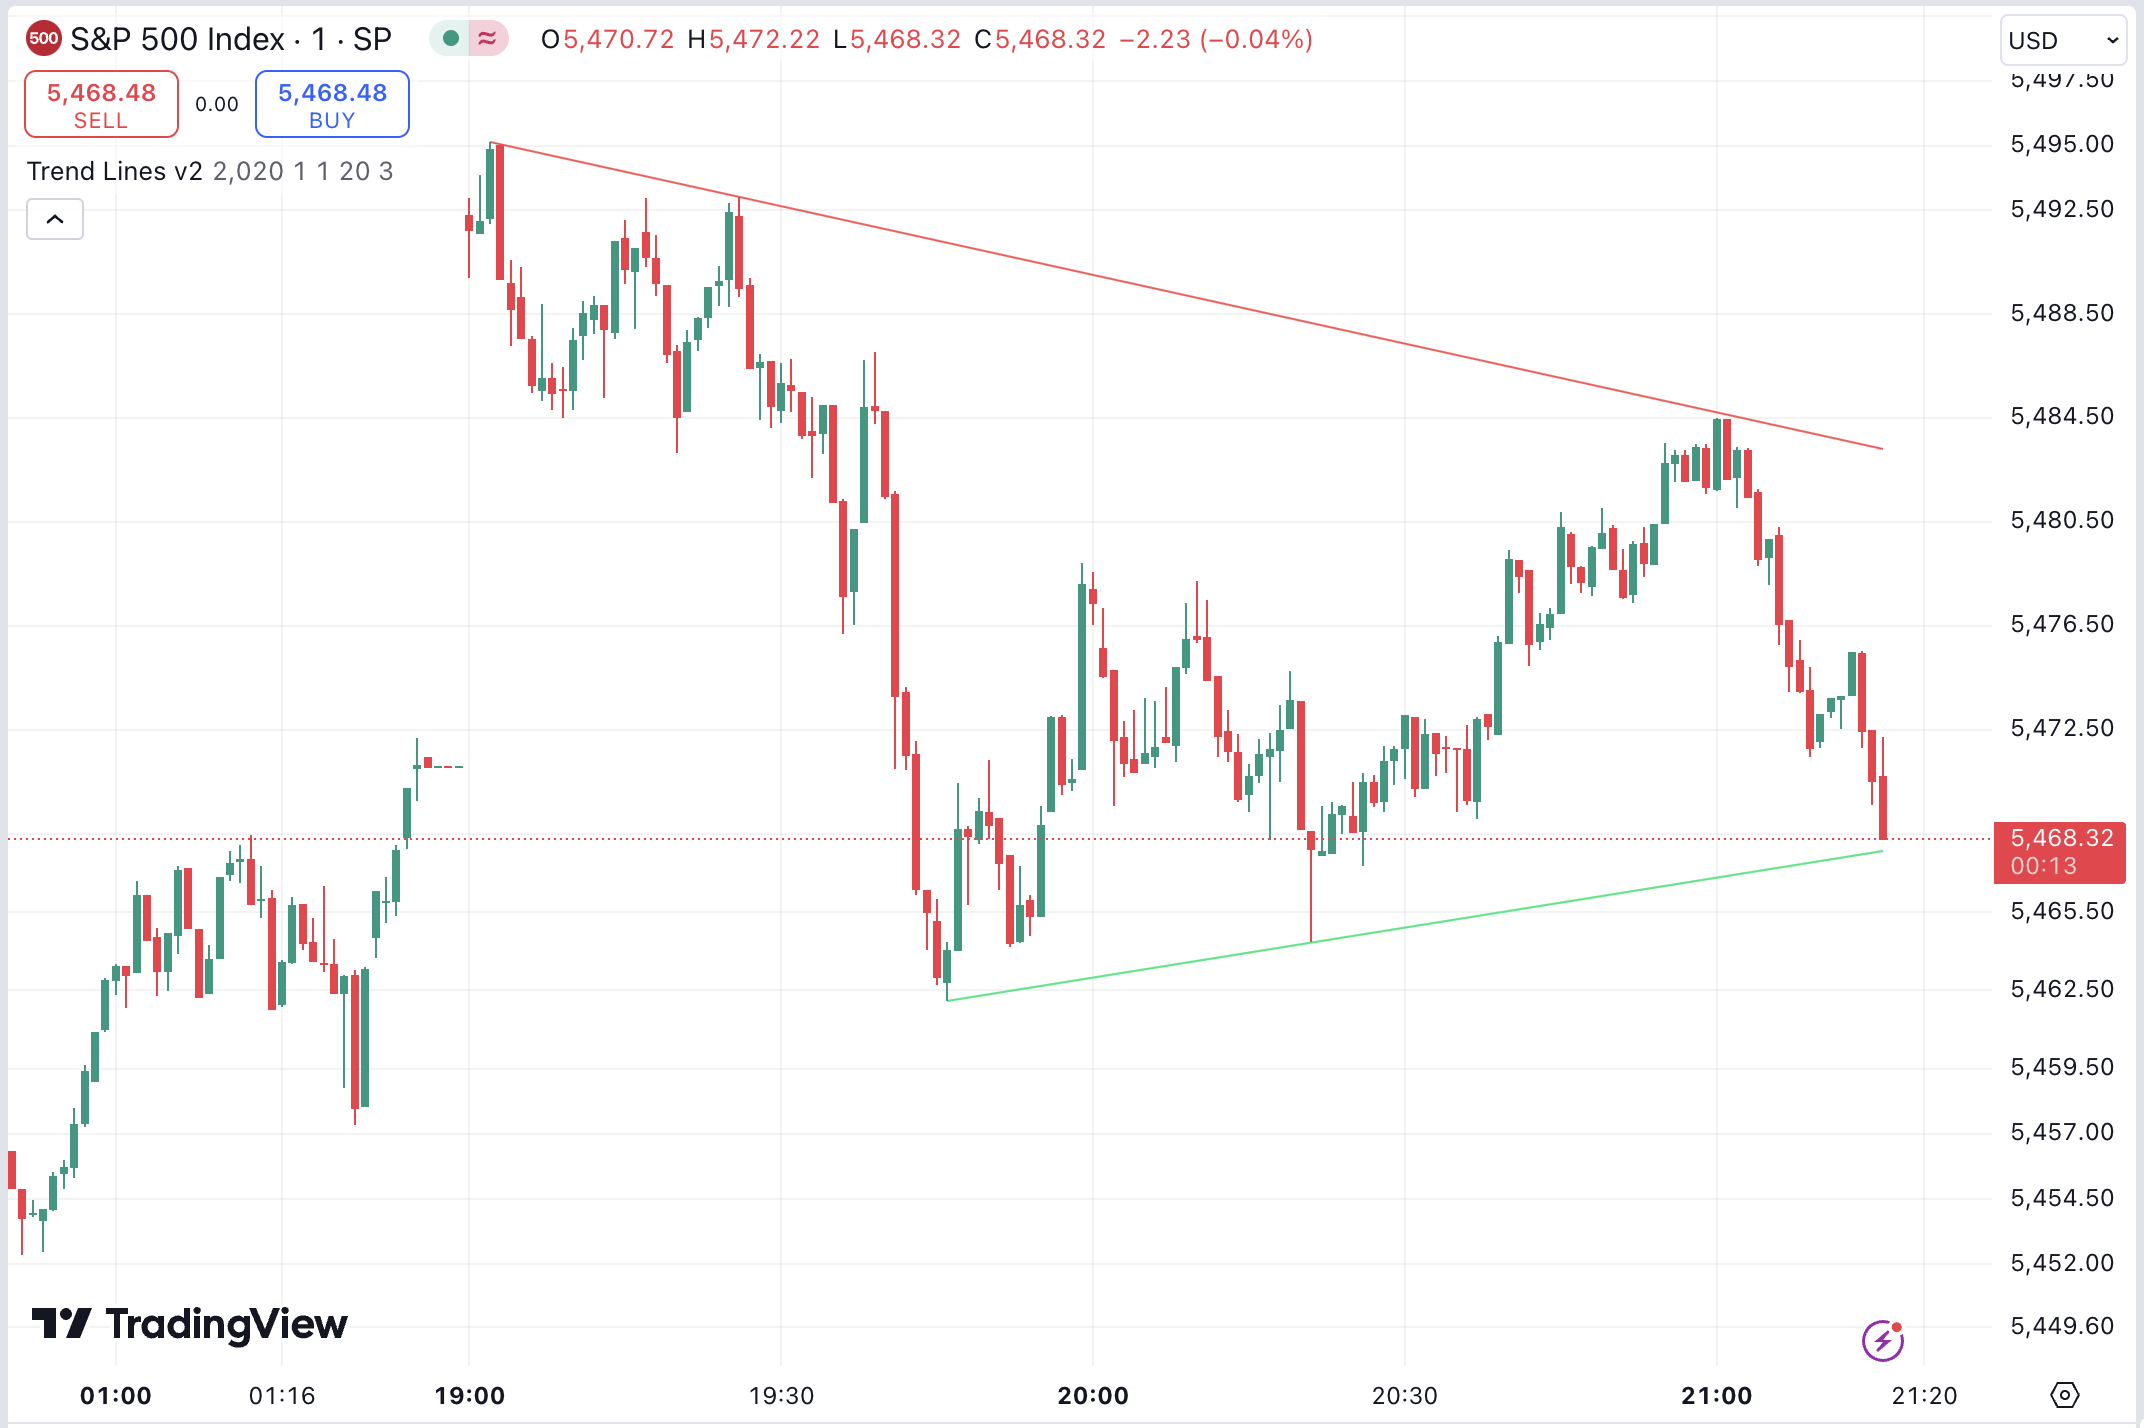
Trendlines
Essential Technical Indicators for Effective Trading Index Strategies
Trend Indicators
Momentum Indicators
Volume Indicators
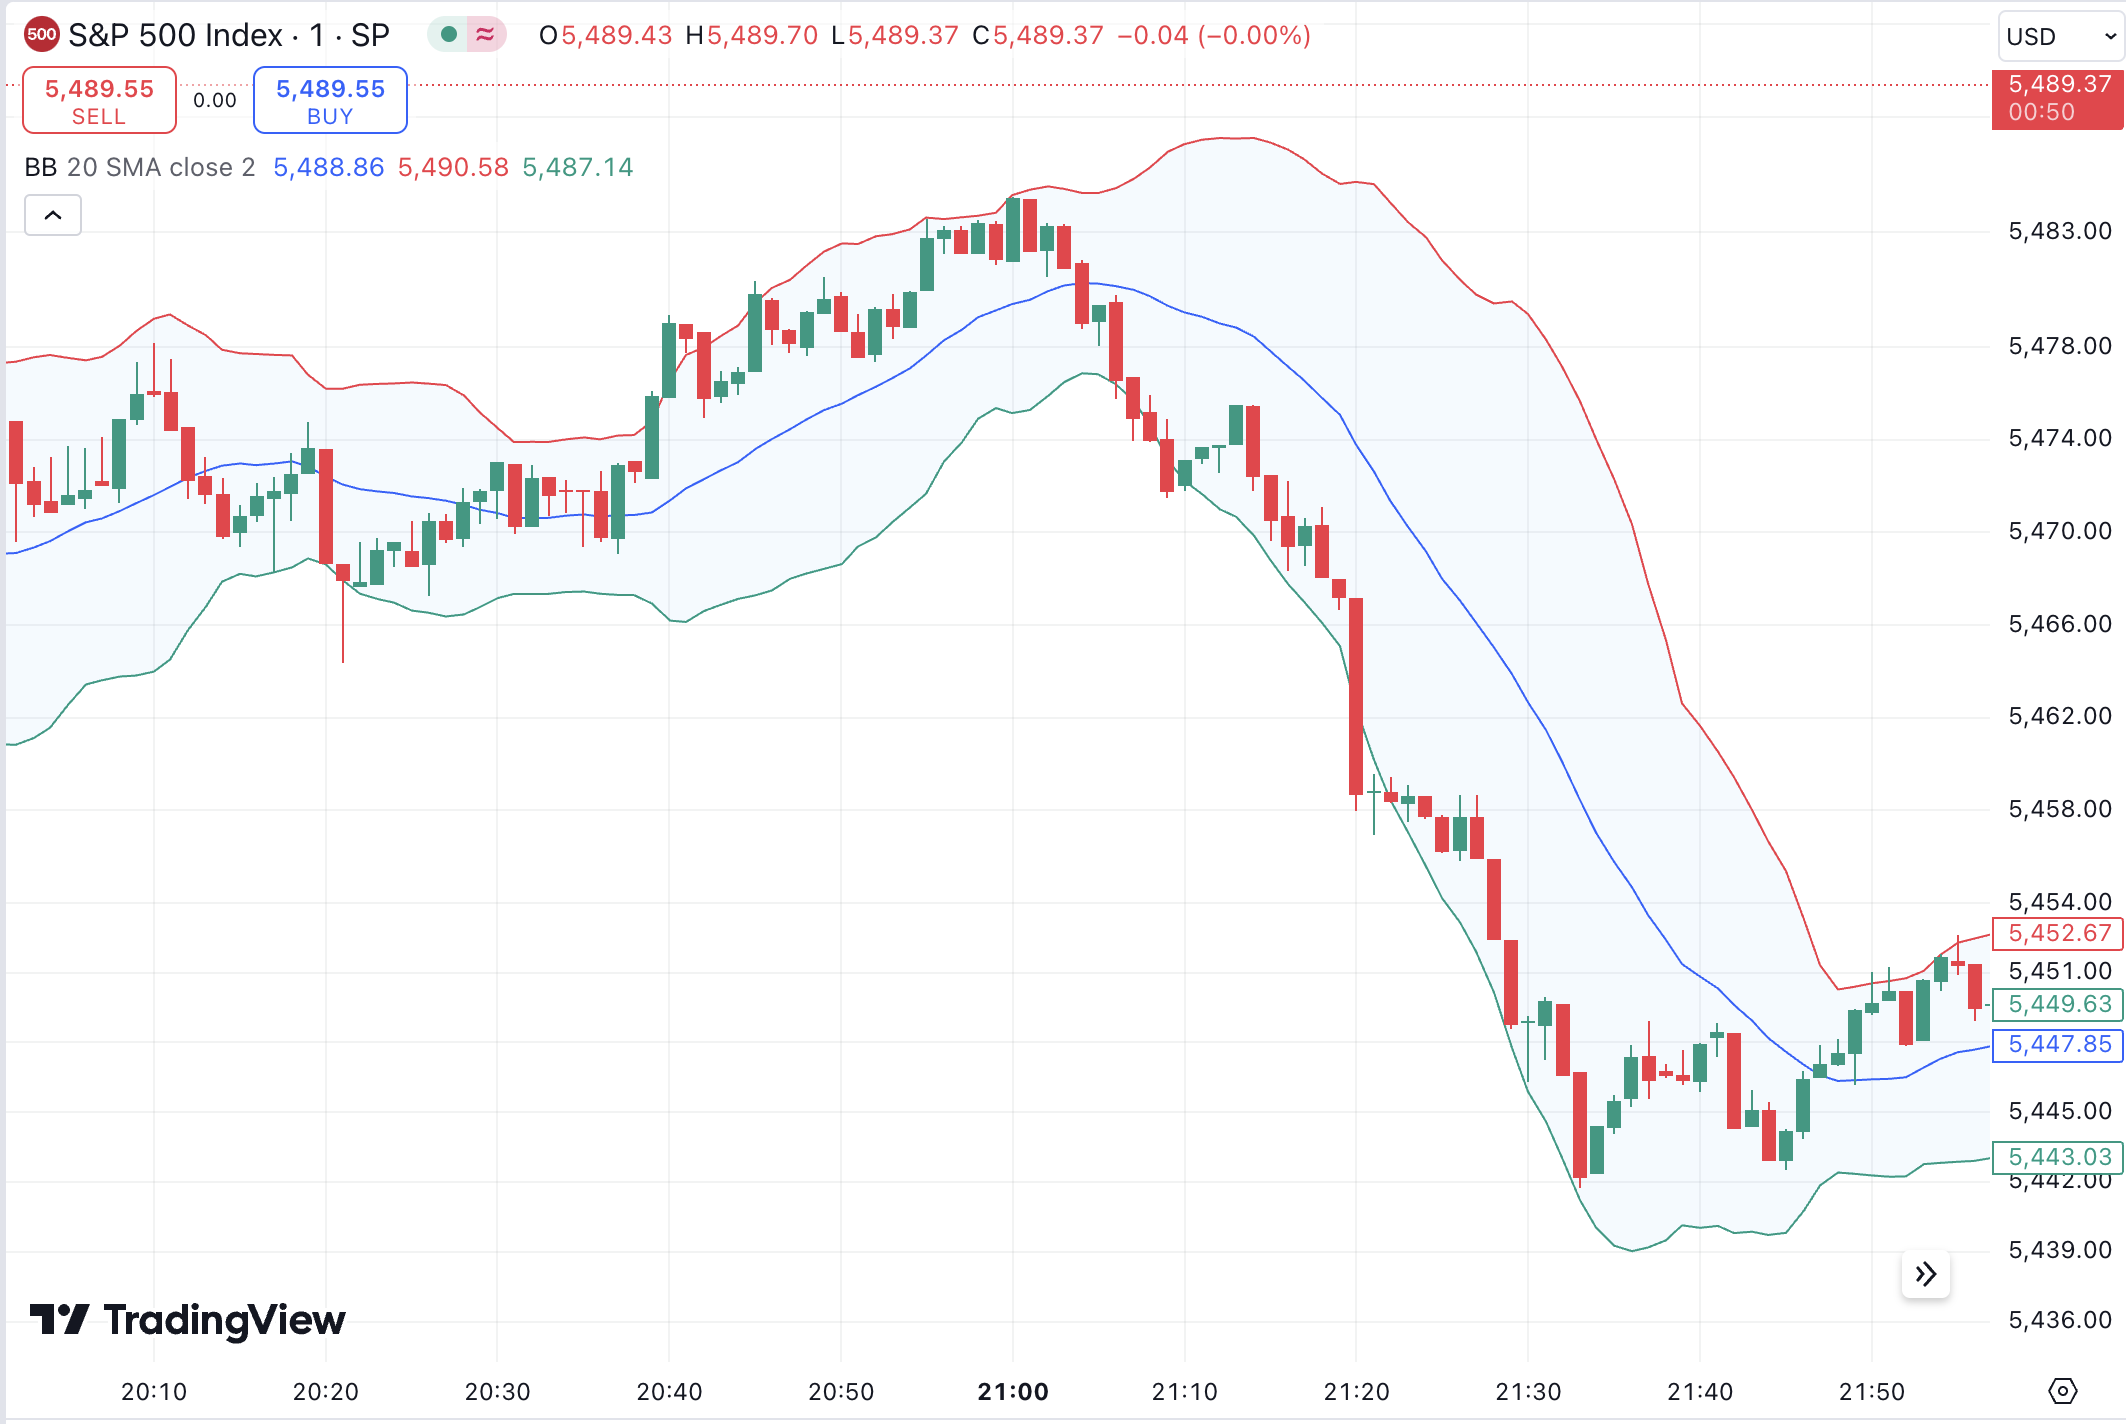
Volatility Indicators
Developing a Robust Index Trading Strategy with Technical Analysis
Step 1: Determine Your Goals
Step 2: Choose a Market or Asset
Step 3: Choose the Right Financial Instrument
Step 4: Find Your Trading Style
Step 5: Choose Technical Indicators and Tools
Step 6: Test Your Strategy in Demo Trading Accounts
Step 7: Adjust Your Strategy
Is Technical Analysis Suitable for Stock Market Index Trading?
Best Brokerage Platforms for Index Trading
1. AvaTrade – Highly Regulated Brokerage Platform With International Indexes
2. eToro – Trade 18 Indexes Across Multiple Markets
3. IG – Trade 80+ Indexes With CFDs
Common Pitfalls to Avoid in Index Trading With Technical Analysis
Best Alternative to Using Technical Analysis Tools For Trading
Conclusion
FAQ
Does technical analysis work for index trading?
What technical indicators are commonly used for index trading?
Can technical analysis predict index price movements accurately?
Does technical analysis help in index trading risk management?